
Research note · Cross-sectional analysis
ETF Universe · Exposure, Skill, and Why SPY Is So Hard to Beat
A reproducible audit of 2,005 mature ETF portfolios that separates exposure from intentional management, then tests whether candidates survive cash, financing, entry-point sensitivity and SPY as opportunity cost.
Executive thesis
1Product abundance is not skill abundance
Traditional metrics remain in place to describe the 2,005 mature ETFs. To decide which products produced a superior path to SPY, we avoid a vote among ratios: RWM is the primary criterion and CAGR provides economic context. 156 products (7.8%) beat SPY's RWM over the same window; 89 (4.4%) also beat its CAGR.
The initial scorecard, metric by metric
| Criterion | Beat SPY | Do not beat SPY | % of universe |
|---|---|---|---|
| CAGR | 204 | 1,801 | 10.2% |
| Sortino | 195 | 1,810 | 9.7% |
| Calmar | 238 | 1,767 | 11.9% |
| Martin | 214 | 1,791 | 10.7% |
| RWM | 156 | 1,849 | 7.8% |
| CAGR + RWM | 89 | 1,916 | 4.4% |
| All four traditional metrics | 58 | 1,947 | 2.9% |
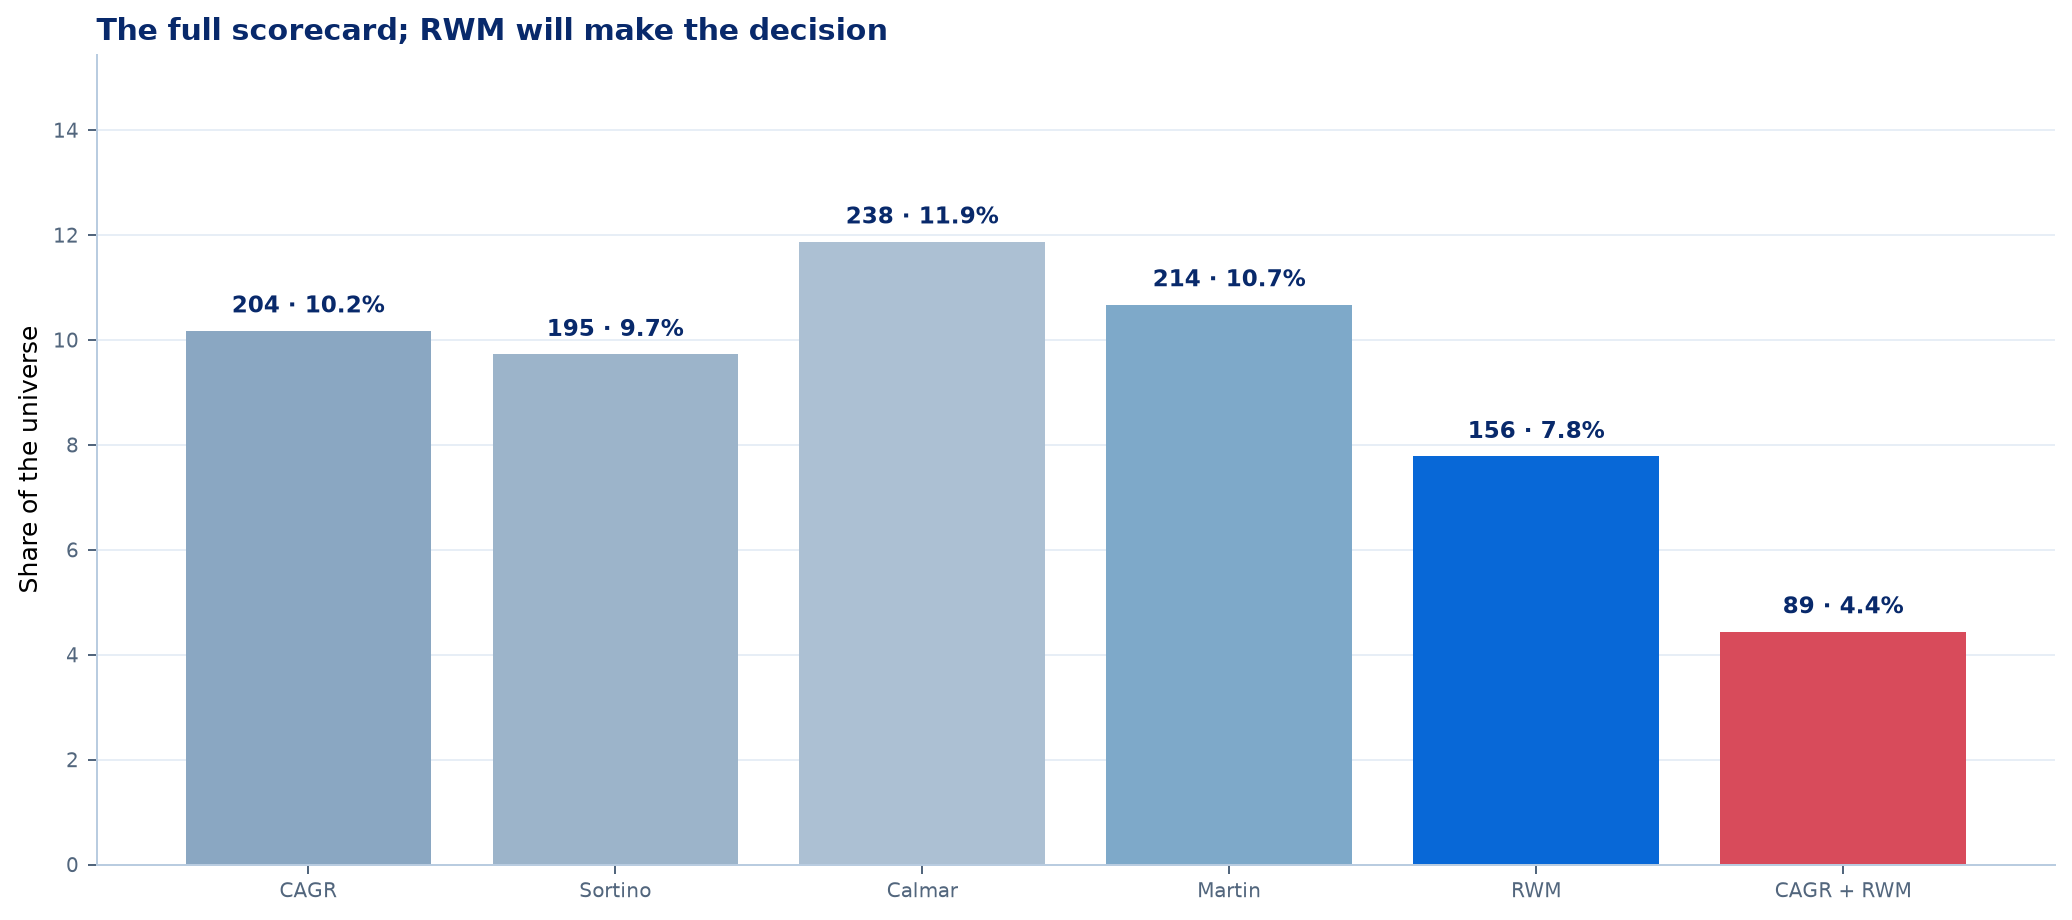
CAGR, Sortino, Calmar and Martin remain descriptive. From here on, RWM drives the comparison and CAGR is the second coordinate—not another vote.
Universe and method
2A demanding comparison that remains reproducible—and honest about its limits
The raw catalogue preserves 9,550 identities, including historical records. Inverse and leveraged exposures, volatility products, structured payoffs and vehicles without verified trading are set aside, not deleted. The analytical sample requires a usable Yahoo start on or before 1 March 2022 and at least 1,008 daily returns.
Same window, total return
Each ETF is aligned with SPY from its first usable session to its own final session. Yahoo Adj Close is used as a total-return proxy, preventing different periods from being compared as if they were equivalent.
SPY as opportunity cost
The question is deliberately hard: “would holding SPY have been better?”. We do not claim that SPY is the natural benchmark for bonds, gold or market-neutral mandates; it is the bar faced by a growth-seeking investor.
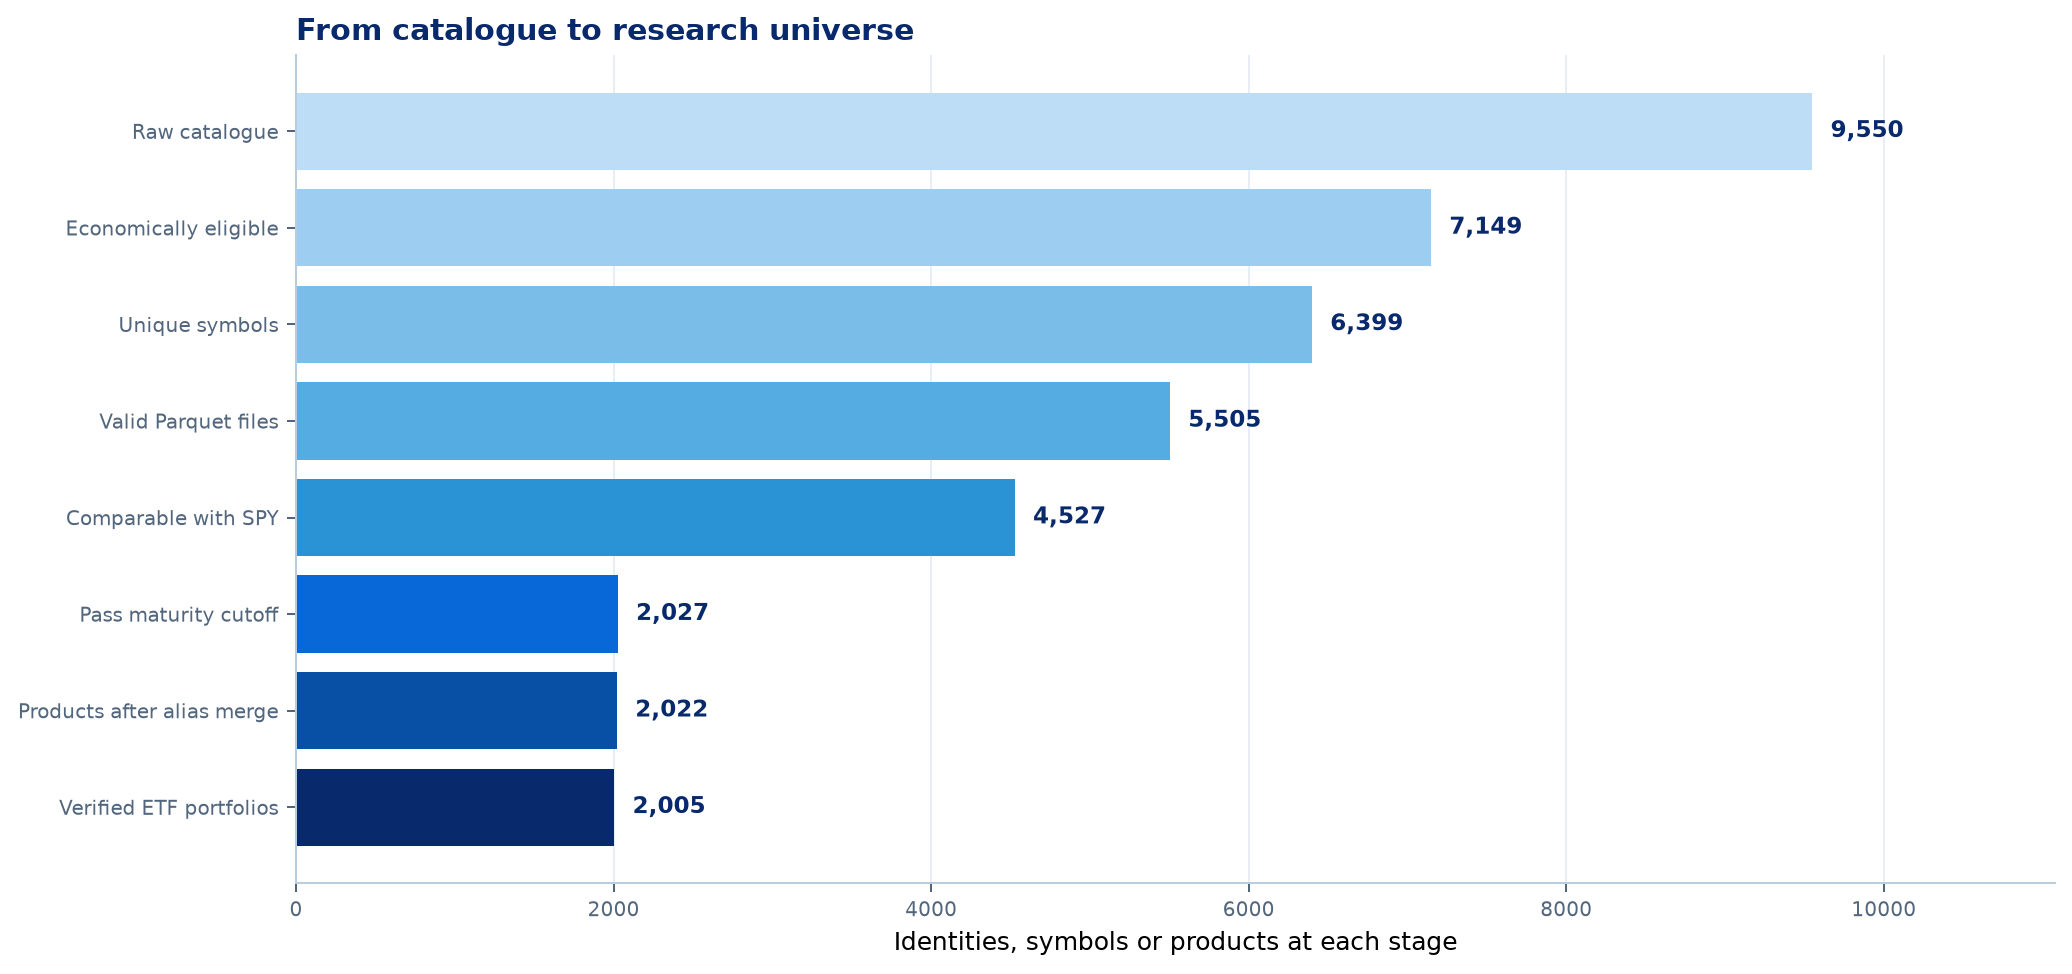
The unit changes from SEC identity to Yahoo symbol and then to economic product. Ticker changes are consolidated to avoid double counting.
Main exclusion groups
| Summary reason | Products |
|---|---|
| Leveraged or inverse | 1358 |
| Structured payoff or tail protection | 538 |
| Non-tradable symbol or vehicle | 444 |
| Never launched or no verified trading | 53 |
| Volatility products | 8 |
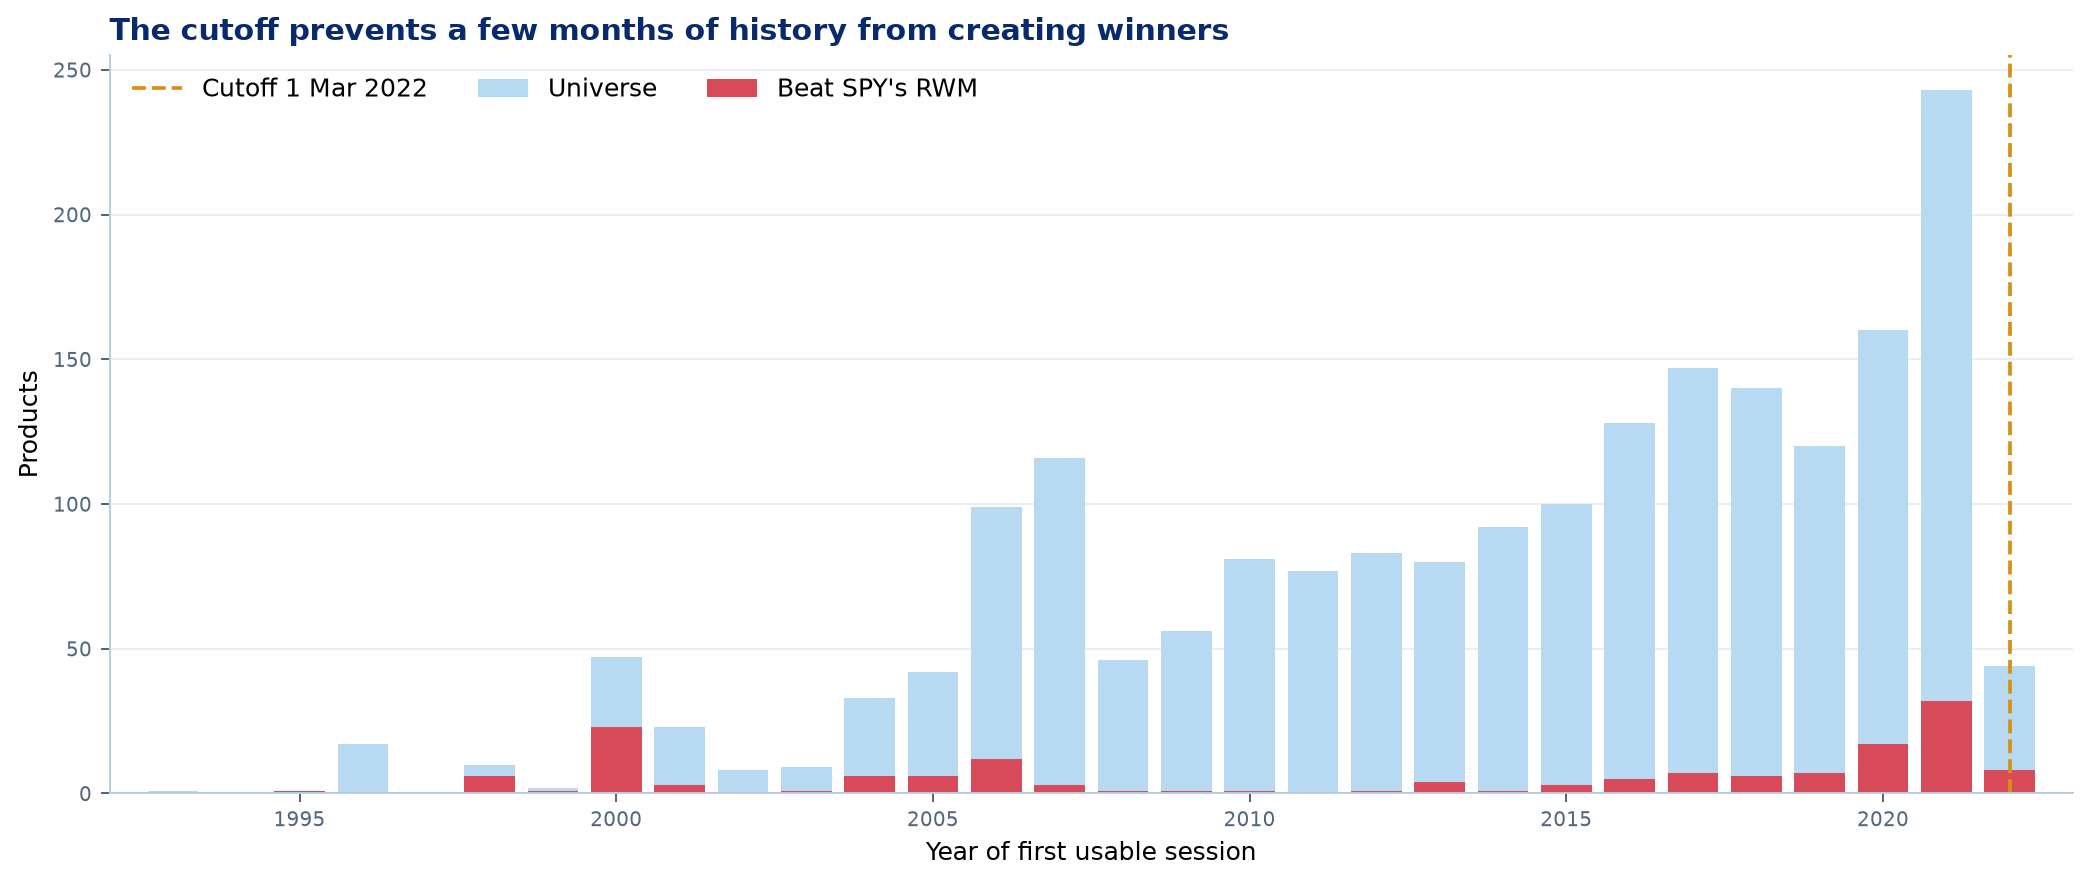
The cutoff does not equalise age. Each ETF is still measured from its own inception; temporal robustness is examined later.
Identities, aliases and unresolved classification
2,027 series pass the initial filter. 5 historical aliases are consolidated, leaving 2,022 economic products; 17 securities that are not ETF portfolios remain in the audit trail but leave the analysis. The final cohort contains 2,005 products.
| Previous ticker | Current ticker | Product |
|---|---|---|
| EWRE | RSPR | Invesco S&P 500 Equal Weight Real Estate ETF |
| GLDX | USG | USCF Gold Strategy Plus Income Fund |
| GRZZ | DARP | Grizzle Growth ETF |
| HSPX | XYLD | Global X S&P 500 Covered Call ETF |
| SDEF | FXED | Sound Enhanced Fixed Income ETF |
Primary asset class still unresolved
| Ticker | Product | Evidence |
|---|---|---|
| GTR | WisdomTree Target Range Fund | asset:unknown|exposure:unclassified|management:free_metadata_insufficient|geography:not_determined|theme:not_thematic|management_audit:non_index_management_identified |
| IPOS | Renaissance Capital Greenwich Fund | asset:unknown|exposure:unclassified|management:free_metadata_insufficient|geography:not_determined|theme:not_thematic|management_audit:index_passive_identified |
| QQQ | Invesco QQQ Trust, Series 1 | asset:unknown|exposure:unclassified|management:free_metadata_insufficient|geography:not_determined|theme:not_thematic|management_audit:index_passive_identified |
| WDNA | WisdomTree BioRevolution Fund | asset:unknown|exposure:unclassified|management:free_metadata_insufficient|geography:not_determined|theme:not_thematic|management_audit:index_passive_identified |
| ZIG | The Acquirers Fund | asset:unknown|exposure:unclassified|management:free_metadata_insufficient|geography:not_determined|theme:not_thematic|management_audit:non_index_management_identified |
Exposure is not skill
3Before assigning credit, identify the risk that was bought
The taxonomy separates intentional management from broad-market beta, concentrated beta, static systematic rules, fixed income and other exposures. The aim is not to diminish index investing; it is to stop a winning sector or asset from being presented as evidence of superior management.
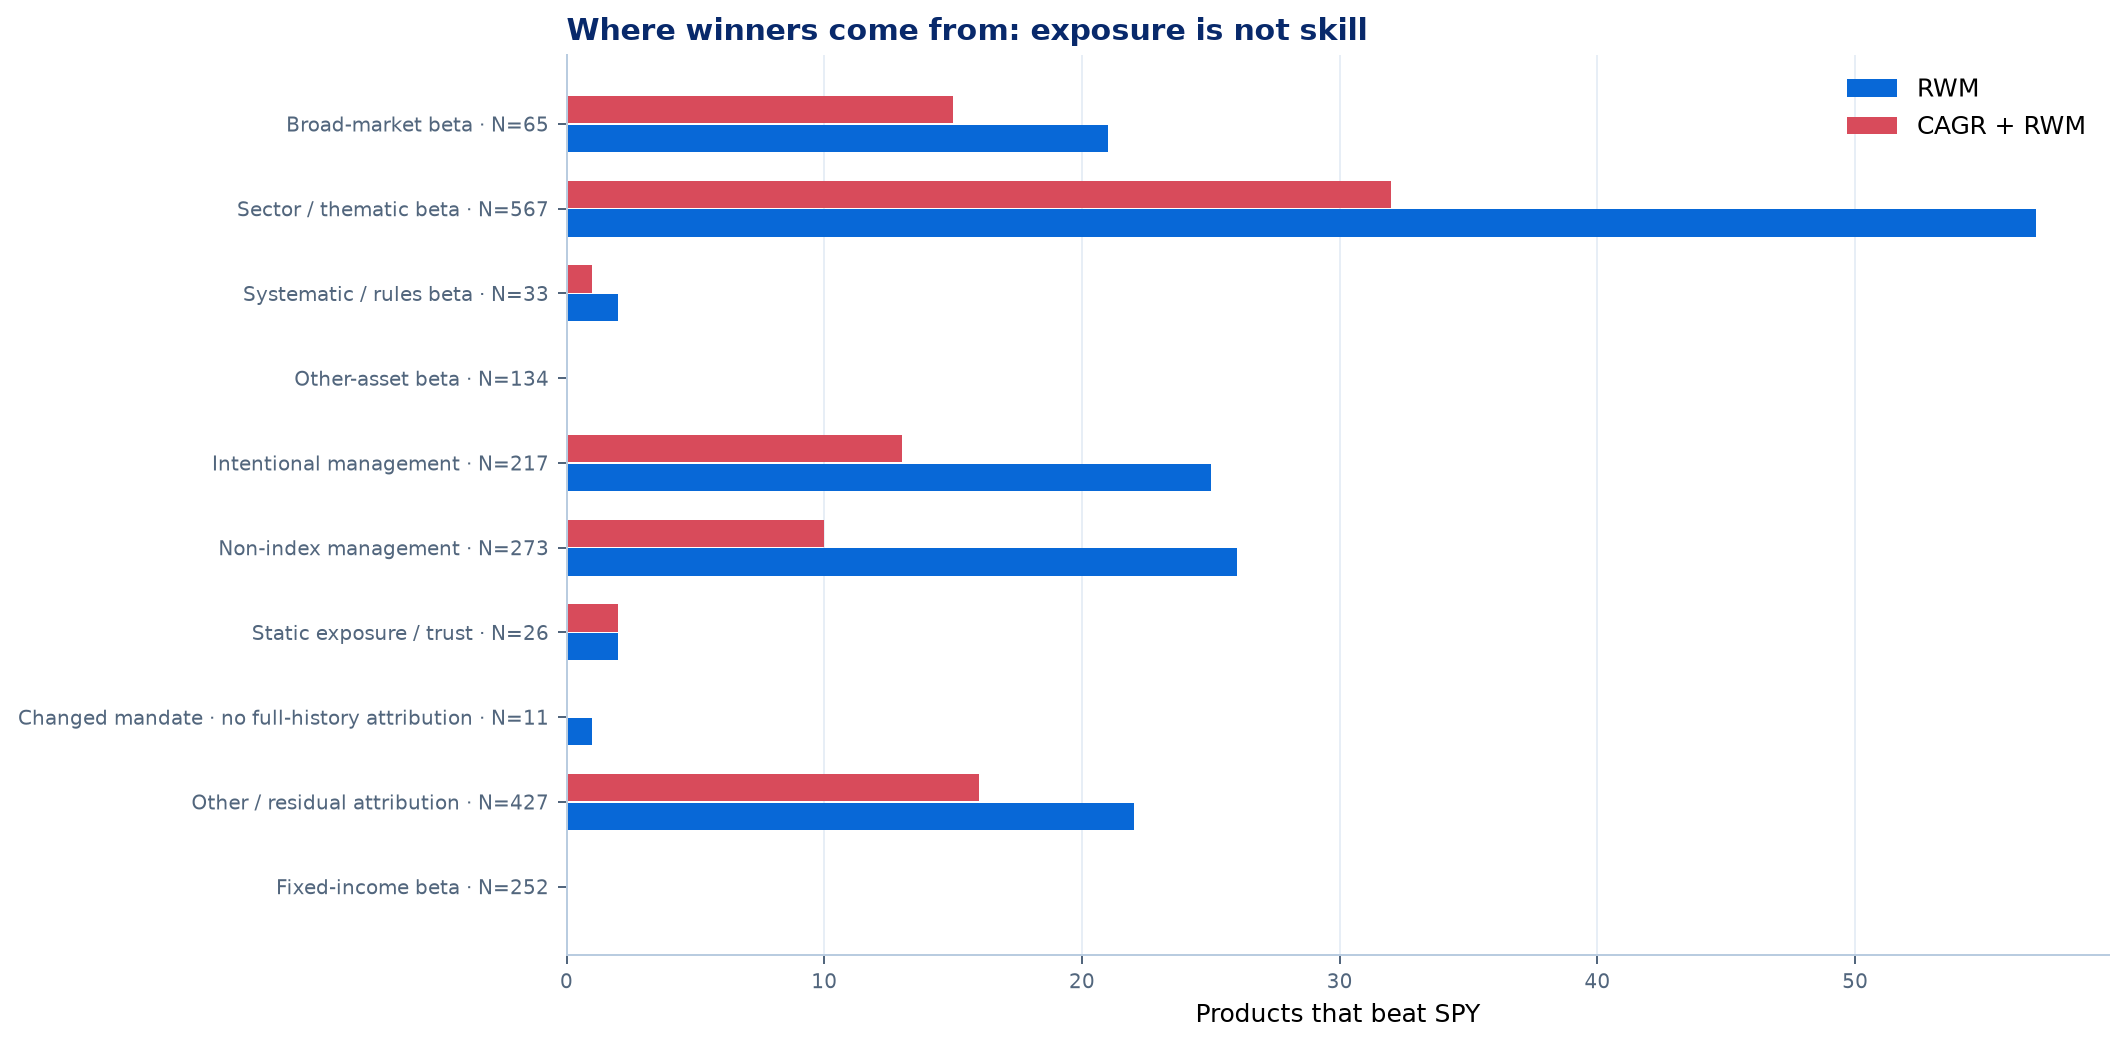
Origin of products that beat RWM and those that also beat CAGR. Management style is assigned on every row; ‘other’ retains only residual economic attribution.
Broad beta
A diversified exposure can be an excellent, inexpensive solution. Its success belongs to the market captured, however—not to a manager repeatedly making superior decisions.
Concentrated beta
Sectors, themes, countries, metals and styles narrow the portfolio and increase regime dependence. Winning ex post may reflect a premium or an exceptional period.
Systematic rules
An alternative index may embody a valid idea. Skill requires evidence that the rule adds value robustly, not merely that its backtest selected a winning exposure.
The central test
4What remains when the product is expected to make decisions?
Two layers prevent intention from being confused with skill: 204 products with identified active management and a wider ring of 13 dynamic or alternative strategies whose active label is not confirmed. The extended block contains 217 products; economic exposure remains a separate axis.
not_determined management label. A negative IS_INDEX response does not, by itself, demonstrate discretionary active management: it is evidence that must be interpreted alongside the prospectus and the documented primary source.
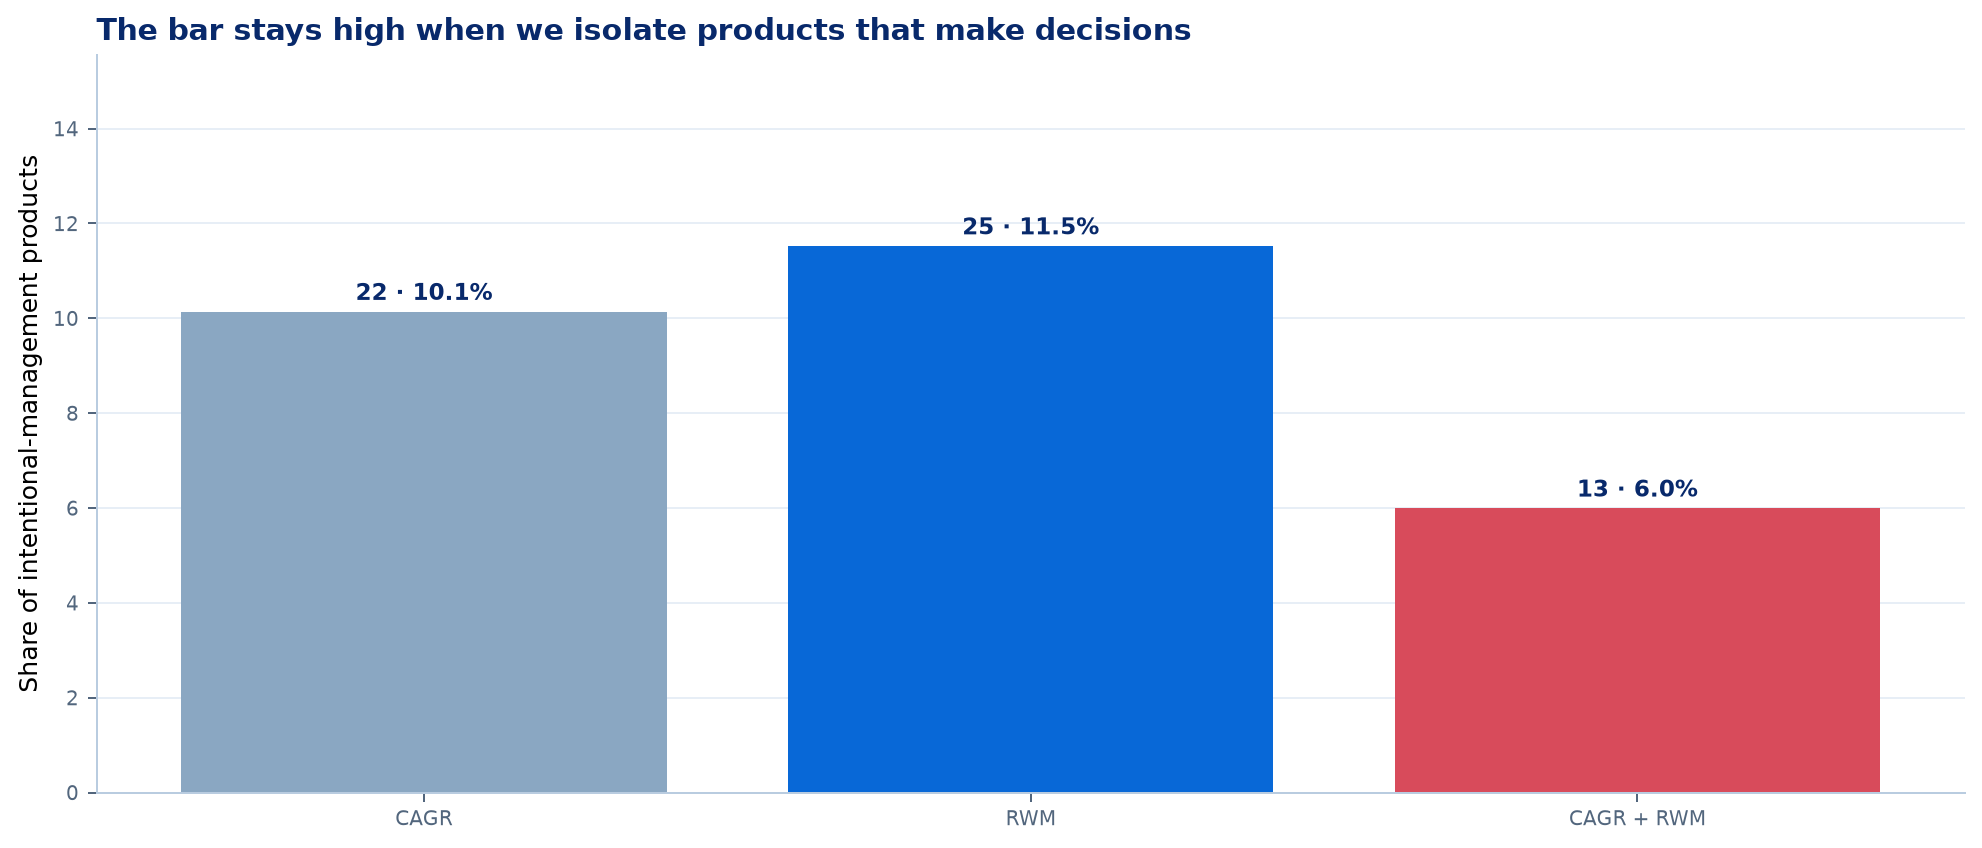
Results for the extended active/dynamic block: CAGR as context, RWM as the criterion and their intersection as the stricter reading.
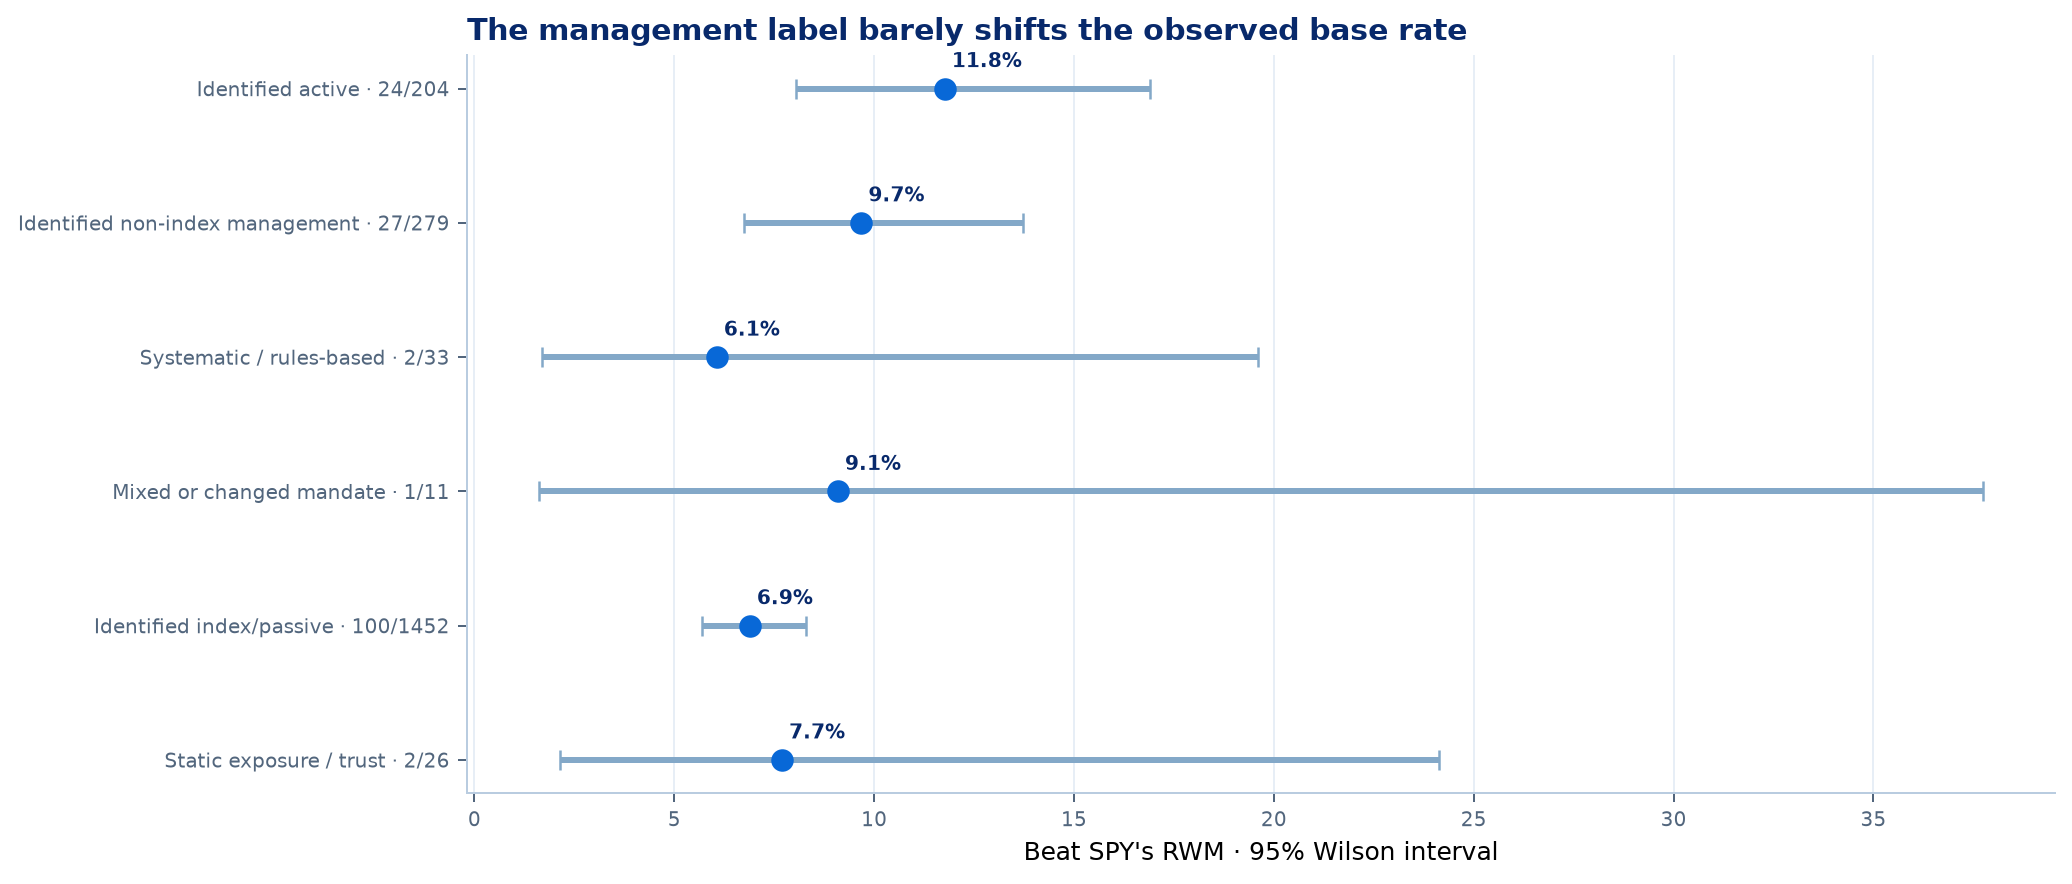
Observed proportions and 95% Wilson intervals. Their overlap is a reminder that a management label is not causal evidence of added value.
The 25 cases that beat SPY's RWM
| Ticker | Product | Strategy | CAGR | SPY CAGR | RWM | SPY RWM | Beats CAGR |
|---|---|---|---|---|---|---|---|
| FFLC | Fidelity Fundamental Large Cap Core ETF | Factor / style | 19.6% | 16.7% | 3.421 | 1.559 | Yes |
| PVAL | Putnam Focused Large Cap Value ETF | Factor / style | 16.8% | 13.7% | 2.572 | 1.063 | Yes |
| CLSE | Convergence Long/Short Equity ETF | Long/short and market neutral | 20.3% | 15.3% | 2.635 | 1.289 | Yes |
| CGDV | Capital Group Dividend Value ETF | Dividend / income | 18.7% | 15.4% | 2.252 | 1.298 | Yes |
| FLV | American Century Focused Large Cap Value ETF | Factor / style | 16.1% | 20.6% | 2.785 | 2.041 | No |
| AVLV | Avantis U.S. Large Cap Value ETF | Factor / style | 15.0% | 13.3% | 1.698 | 0.957 | Yes |
| SIXH | ETC 6 Meridian Hedged Equity Index Option ETF | Long/short and market neutral | 11.4% | 18.2% | 2.429 | 1.737 | No |
| DFIV | Dimensional International Value ETF | Factor / style | 16.4% | 13.1% | 1.626 | 0.944 | Yes |
| DIVO | Amplify CWP Enhanced Dividend Income ETF | Dividend / income | 12.9% | 15.2% | 2.228 | 1.568 | No |
| PWRD | TCW Transform Systems ETF | Equity · other | 19.3% | 14.1% | 1.791 | 1.160 | Yes |
| DARP | Grizzle Growth ETF | Factor / style | 20.4% | 13.0% | 1.420 | 0.886 | Yes |
| MBOX | Freedom Day Dividend ETF | Dividend / income | 12.6% | 13.8% | 1.510 | 1.075 | No |
| TEQI | T. Rowe Price Equity Income ETF | Dividend / income | 15.3% | 16.4% | 1.909 | 1.492 | No |
| JAVA | JPMorgan Active Value ETF | Factor / style | 12.4% | 13.9% | 1.373 | 1.015 | No |
| FBCV | Fidelity Blue Chip Value ETF | Factor / style | 14.2% | 16.7% | 1.846 | 1.559 | No |
| HEQT | Simplify Hedged Equity ETF | Long/short and market neutral | 9.4% | 12.6% | 1.075 | 0.872 | No |
| AVIV | Avantis International Large Cap Value ETF | Factor / style | 14.4% | 14.1% | 1.189 | 1.034 | Yes |
| FLLV | Franklin Liberty U.S. Low Volatility ETF | Factor / style | 13.1% | 15.4% | 1.740 | 1.601 | No |
| DUHP | Dimensional US High Profitability ETF | Equity · other | 13.9% | 15.4% | 1.417 | 1.298 | No |
| CGUS | Capital Group Core Equity ETF | Equity · other | 15.5% | 15.4% | 1.394 | 1.298 | Yes |
| TSPA | T. Rowe Price U.S. Equity Research ETF | Equity · other | 14.1% | 13.6% | 1.101 | 1.036 | Yes |
| AVUS | Avantis U.S. Equity ETF | Equity · other | 16.4% | 16.3% | 1.527 | 1.471 | Yes |
| THRO | iShares U.S. Thematic Rotation Active ETF | Thematic equity | 13.5% | 12.7% | 0.879 | 0.861 | Yes |
| RFDA | ALPS Dynamic US Dividend Advantage ETF | Dividend / income | 13.6% | 15.4% | 1.631 | 1.614 | No |
| DFAU | Dimensional US Core Equity Market ETF | Equity · other | 15.4% | 15.7% | 1.370 | 1.369 | No |
Lowering the return bar—without giving away the result
512 candidates show better RWM but still trail SPY's return
We select 12 products from the active/dynamic block that do not beat SPY's CAGR but do beat its RWM: 11 have identified active management and 1 is an inferred dynamic strategy. This is the right place to ask whether a more efficient relative path can become competitive through moderate leverage.
Why they qualify
RWM recognises growth over cash and penalises periods in which relative wealth remains below prior highs. It identifies useful paths without prematurely declaring absolute winners.
What they have not earned
Better RWM alone is not enough. They must match SPY's terminal wealth after financing the debt—and the RWM advantage must survive.
The 12 relative-efficiency candidates
| Ticker | Product | Asset class | Strategy | Identified process | CAGR | SPY CAGR | RWM | SPY RWM |
|---|---|---|---|---|---|---|---|---|
| FLV | American Century Focused Large Cap Value ETF | Equity | Factor / style | Identified active | 16.1% | 20.6% | 2.785 | 2.041 |
| SIXH | ETC 6 Meridian Hedged Equity Index Option ETF | Alternatives | Long/short and market neutral | Identified active | 11.4% | 18.2% | 2.429 | 1.737 |
| DIVO | Amplify CWP Enhanced Dividend Income ETF | Equity | Dividend / income | Identified active | 12.9% | 15.2% | 2.228 | 1.568 |
| MBOX | Freedom Day Dividend ETF | Equity | Dividend / income | Identified active | 12.6% | 13.8% | 1.510 | 1.075 |
| TEQI | T. Rowe Price Equity Income ETF | Equity | Dividend / income | Identified active | 15.3% | 16.4% | 1.909 | 1.492 |
| JAVA | JPMorgan Active Value ETF | Equity | Factor / style | Identified active | 12.4% | 13.9% | 1.373 | 1.015 |
| FBCV | Fidelity Blue Chip Value ETF | Equity | Factor / style | Identified active | 14.2% | 16.7% | 1.846 | 1.559 |
| HEQT | Simplify Hedged Equity ETF | Alternatives | Long/short and market neutral | Identified non-index management | 9.4% | 12.6% | 1.075 | 0.872 |
| FLLV | Franklin Liberty U.S. Low Volatility ETF | Equity | Factor / style | Identified active | 13.1% | 15.4% | 1.740 | 1.601 |
| DUHP | Dimensional US High Profitability ETF | Equity | Equity · other | Identified active | 13.9% | 15.4% | 1.417 | 1.298 |
| RFDA | ALPS Dynamic US Dividend Advantage ETF | Equity | Dividend / income | Identified active | 13.6% | 15.4% | 1.631 | 1.614 |
| DFAU | Dimensional US Core Equity Market ETF | Equity | Equity · other | Identified active | 15.4% | 15.7% | 1.370 | 1.369 |
Leverage ladder
6Leverage can lift CAGR. It cannot manufacture skill.
Exposure is purchased once with fixed initial debt and then allowed to evolve. There is no daily rebalancing or invented turnover: leverage drifts with the market. Debt accrues the daily Effective Federal Funds Rate plus a 1.50% base spread under Actual/360.
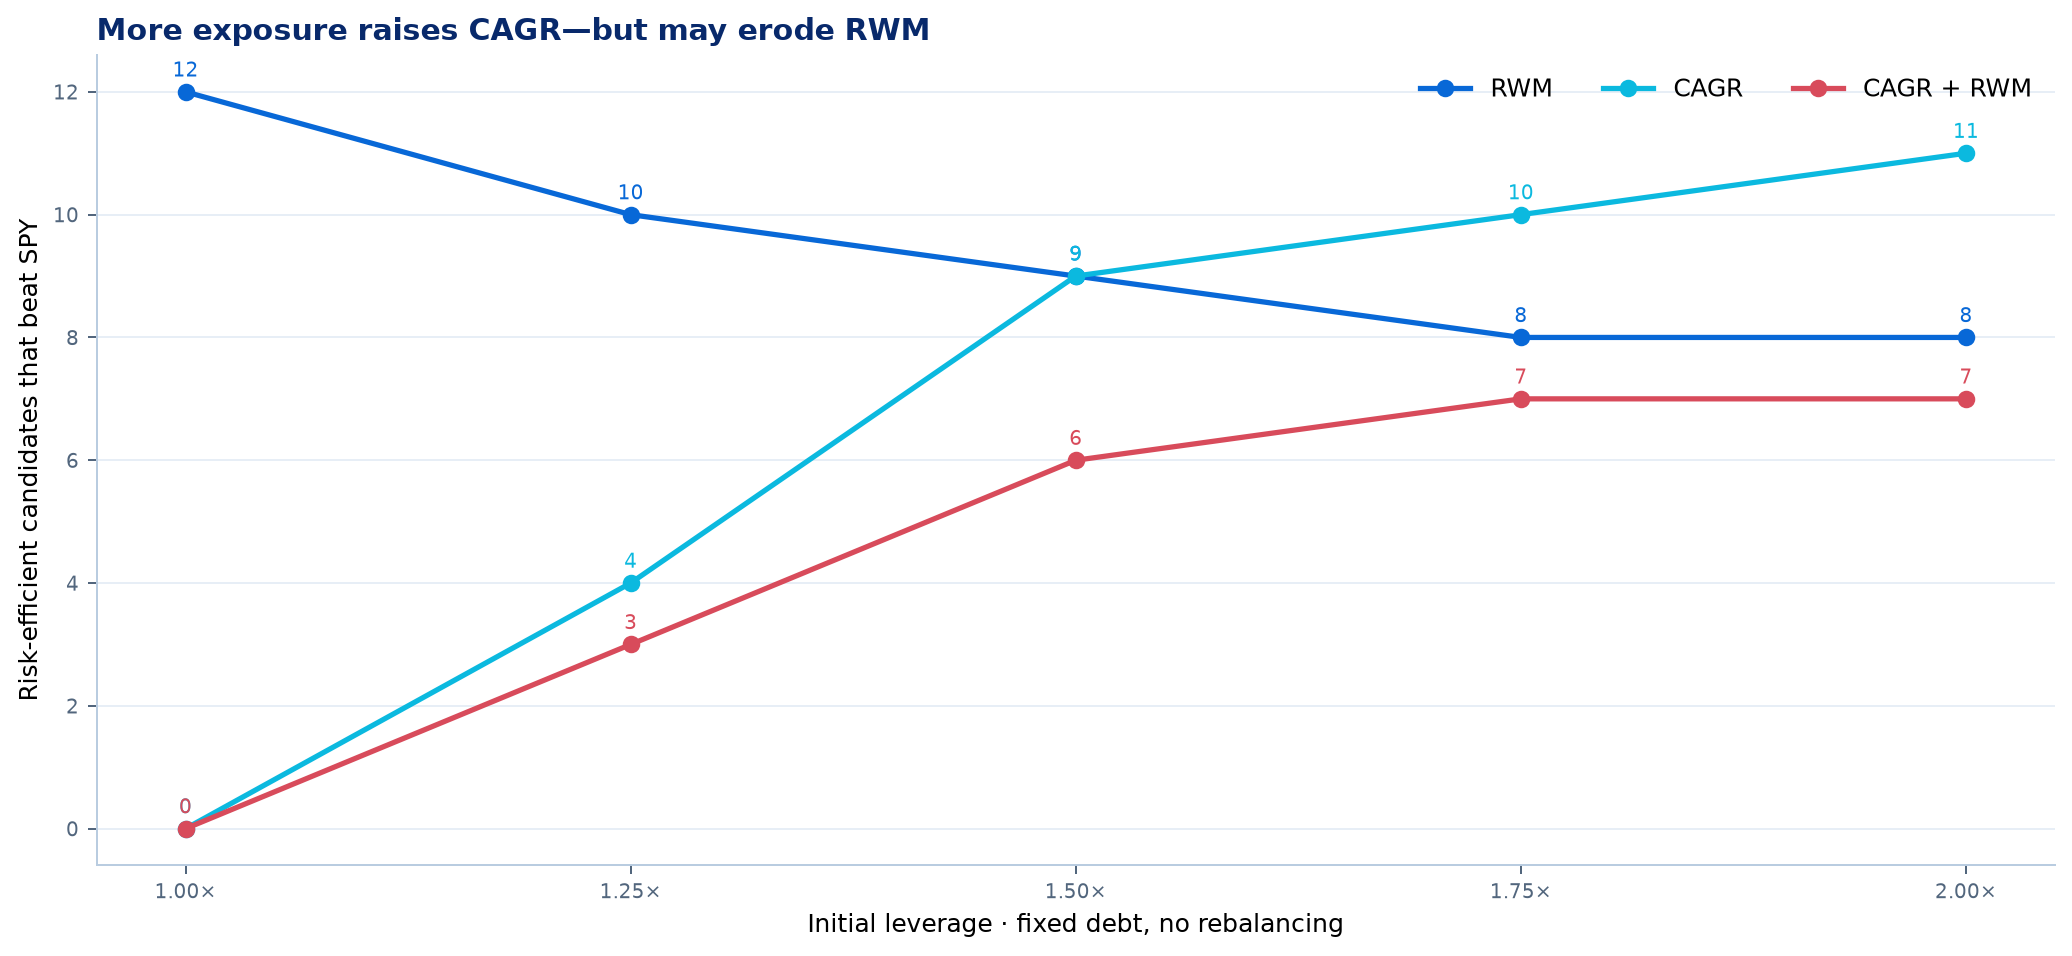
Counts refer to the 12 candidates. Leverage is fixed at inception; constant exposure is not targeted.
| Initial leverage | Candidates | Beat CAGR | Preserve RWM | Beat both |
|---|---|---|---|---|
| 1.00× | 12 | 0 | 12 | 0 |
| 1.25× | 12 | 4 | 10 | 3 |
| 1.50× | 12 | 9 | 9 | 6 |
| 1.75× | 12 | 10 | 8 | 7 |
| 2.00× | 12 | 11 | 8 | 7 |
The financing structure is a historical “IBKR-style” scenario, not an exact reconstruction of every past rate. IBKR publishes rates as benchmark plus spread, calculated daily and, for USD, on Actual/360. Official sources: margin rates, calculation method and the Effective Federal Funds Rate (FRED).
Exact return matching
7Same ending. Very different journey.
We solve ex post for the exact initial leverage required to finish with the same wealth as SPY. This is a diagnostic—not an invertible rule—and it is capped at 2.00×. 11 of 12 candidates can reach the target; 8 retain a higher RWM after financing.
Different paths to the same terminal wealth
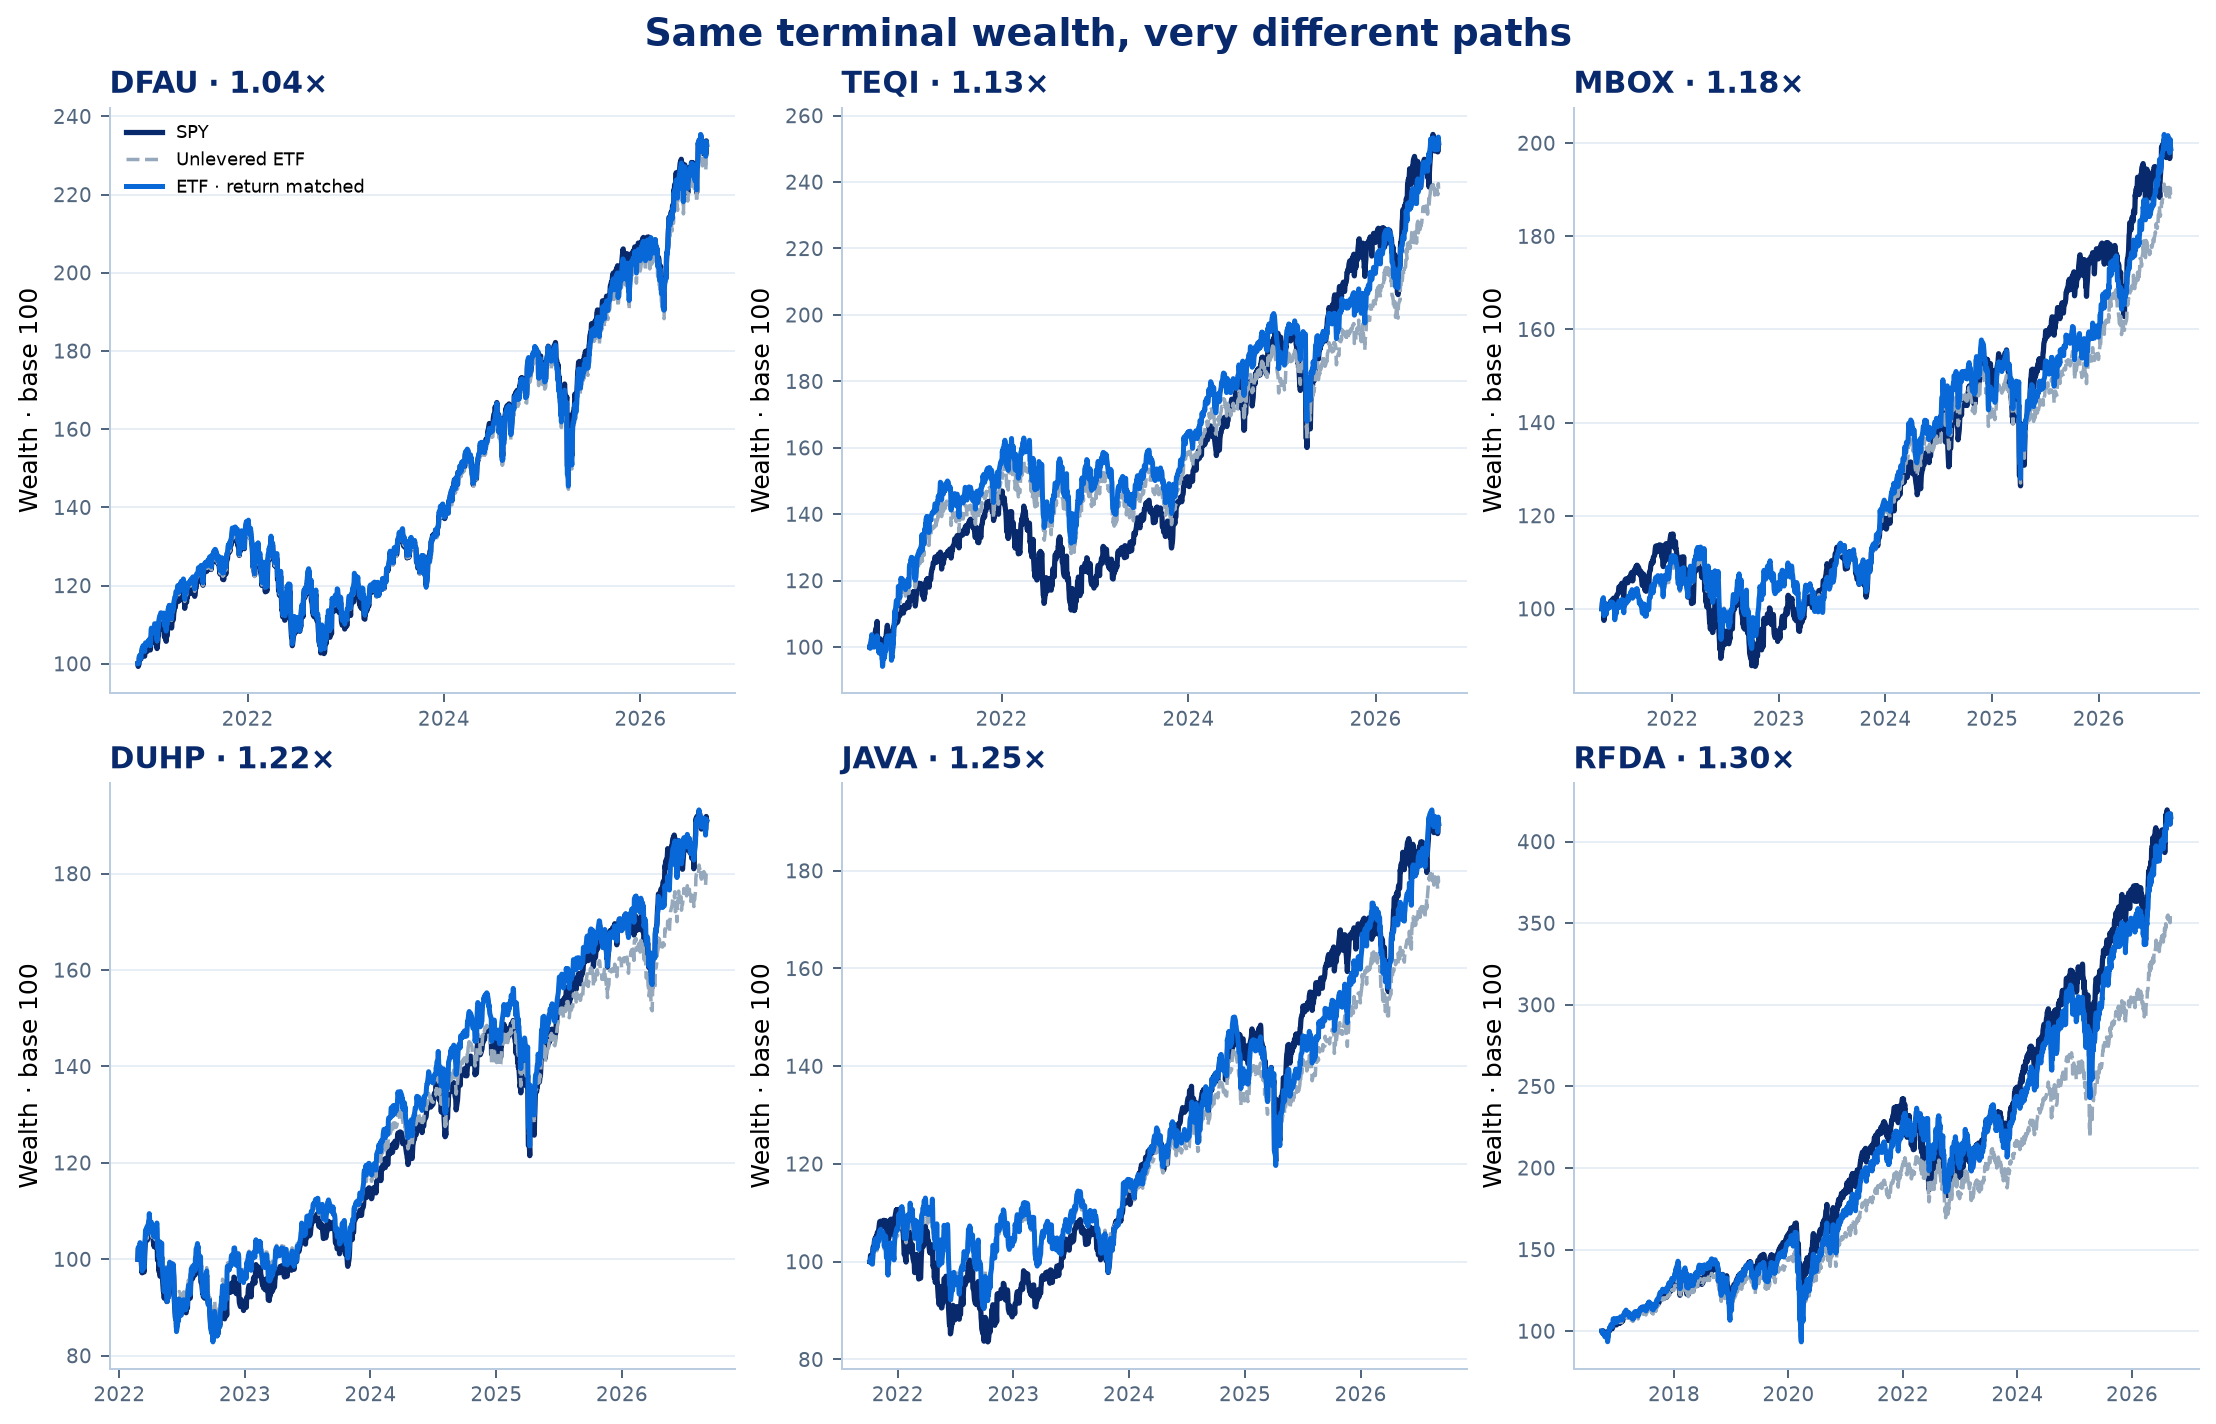
Each panel begins at 100 on the ETF's inception date. The levered line includes historical financing and ends beside SPY by construction; the relevant difference is the path of relative wealth.
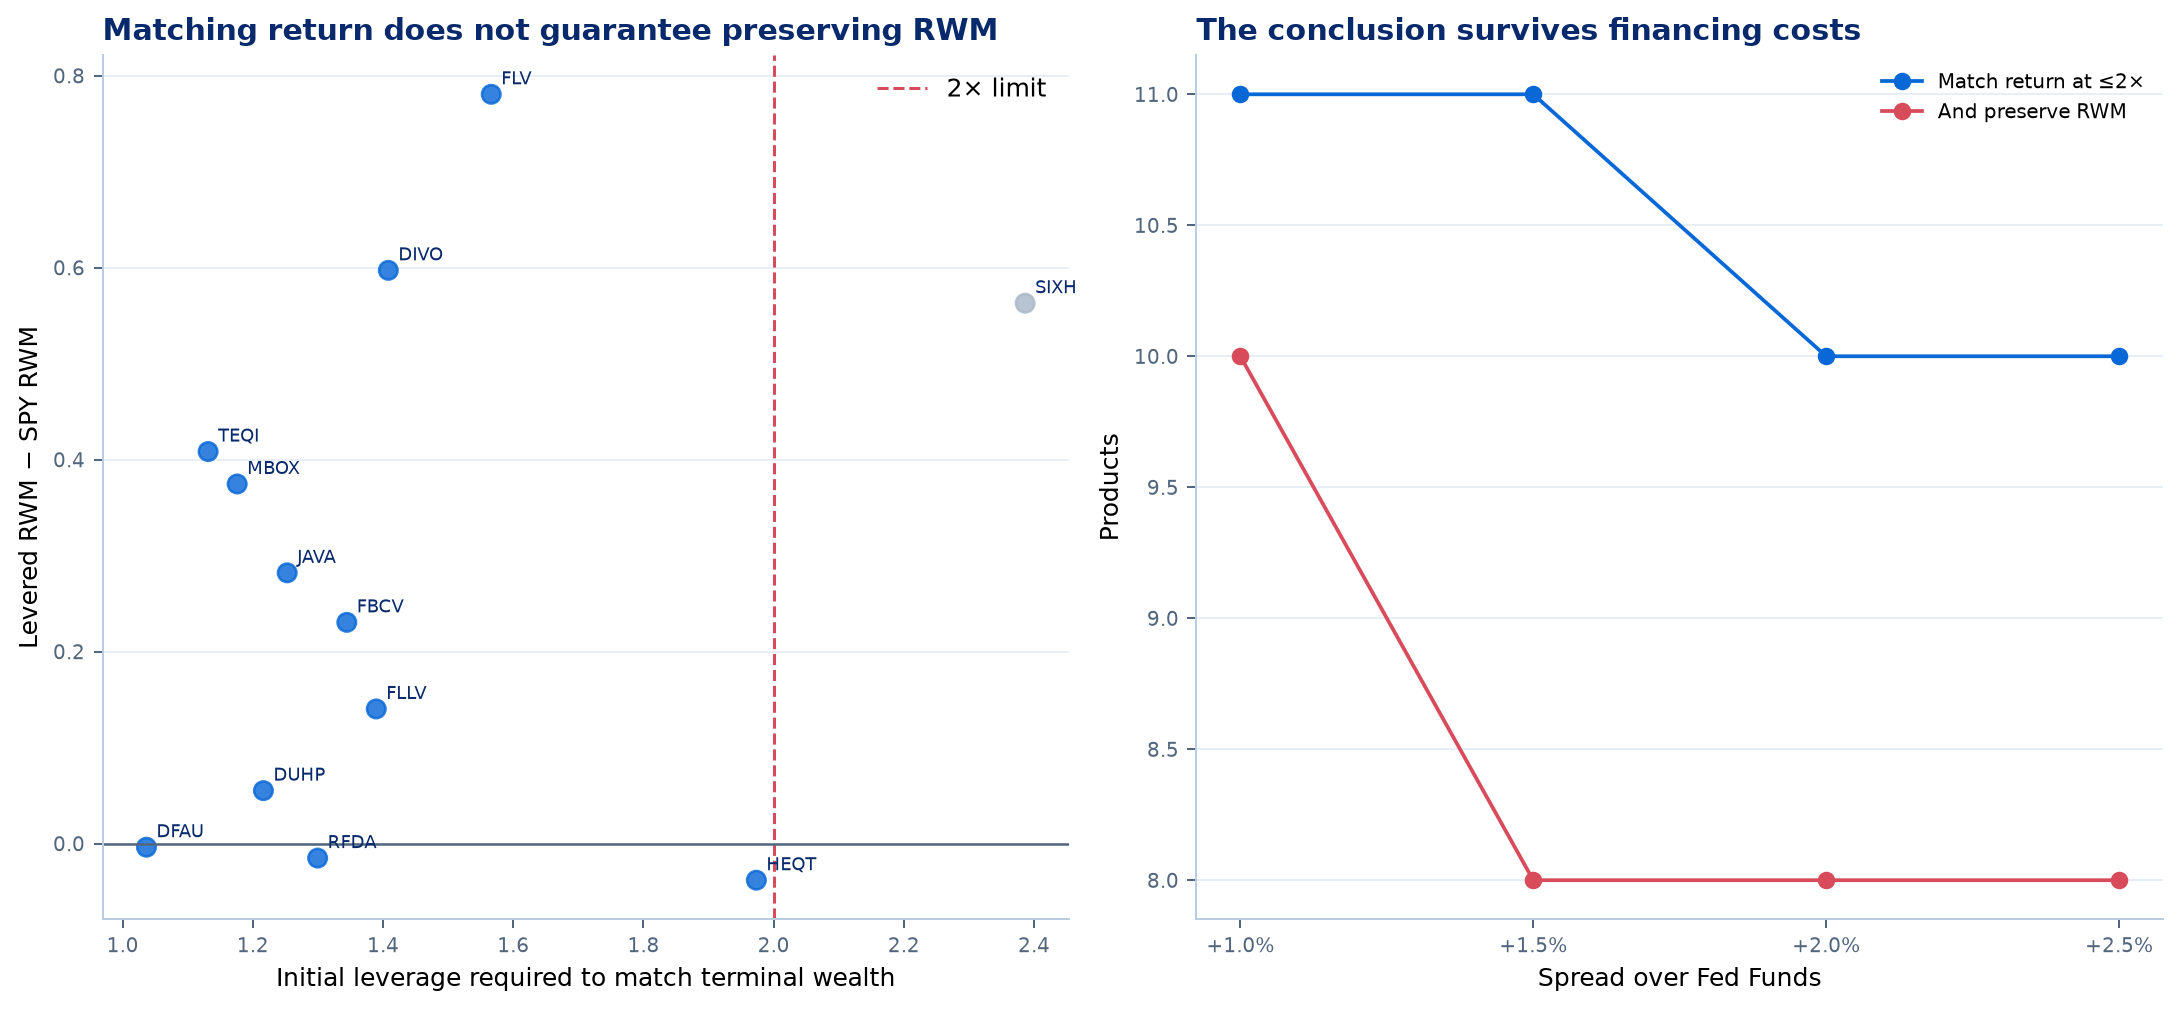
Left: RWM after matching return. Right: sensitivity to the financing spread over Fed Funds.
Outcome by product
| Ticker | Product | Strategy | Identified process | Required leverage | Matched RWM | SPY RWM | Outcome |
|---|---|---|---|---|---|---|---|
| DFAU | Dimensional US Core Equity Market ETF | Equity · other | Identified active | 1.04× | 1.365 | 1.369 | Matches; loses RWM |
| TEQI | T. Rowe Price Equity Income ETF | Dividend / income | Identified active | 1.13× | 1.900 | 1.492 | Matches and preserves RWM |
| MBOX | Freedom Day Dividend ETF | Dividend / income | Identified active | 1.18× | 1.449 | 1.075 | Matches and preserves RWM |
| DUHP | Dimensional US High Profitability ETF | Equity · other | Identified active | 1.22× | 1.353 | 1.298 | Matches and preserves RWM |
| JAVA | JPMorgan Active Value ETF | Factor / style | Identified active | 1.25× | 1.297 | 1.015 | Matches and preserves RWM |
| RFDA | ALPS Dynamic US Dividend Advantage ETF | Dividend / income | Identified active | 1.30× | 1.599 | 1.614 | Matches; loses RWM |
| FBCV | Fidelity Blue Chip Value ETF | Factor / style | Identified active | 1.34× | 1.790 | 1.559 | Matches and preserves RWM |
| FLLV | Franklin Liberty U.S. Low Volatility ETF | Factor / style | Identified active | 1.39× | 1.741 | 1.601 | Matches and preserves RWM |
| DIVO | Amplify CWP Enhanced Dividend Income ETF | Dividend / income | Identified active | 1.41× | 2.165 | 1.568 | Matches and preserves RWM |
| FLV | American Century Focused Large Cap Value ETF | Factor / style | Identified active | 1.57× | 2.821 | 2.041 | Matches and preserves RWM |
| HEQT | Simplify Hedged Equity ETF | Long/short and market neutral | Identified non-index management | 1.97× | 0.833 | 0.872 | Matches; loses RWM |
| SIXH | ETC 6 Meridian Hedged Equity Index Option ETF | Long/short and market neutral | Identified active | 2.39× | 2.300 | 1.737 | Requires more than 2× |
Financing-cost sensitivity
| Spread over Fed Funds | Feasible at ≤ 2× | Preserve RWM |
|---|---|---|
| 1.0% | 11 | 10 |
| 1.5% | 11 | 8 |
| 2.0% | 10 | 8 |
| 2.5% | 10 | 8 |
The 25% maintenance threshold is illustrative; actual requirements depend on broker, portfolio and product. Return matching uses ex-post information and must not be interpreted as an executable strategy.
Entry-point stability
8A launch-to-date win is not enough
The 25 RWM winners in the managed block are compared with SPY again from different entry months using rolling windows of roughly three years. 12 beat SPY's RWM from a majority of entry points. Because the windows overlap, this is temporal sensitivity—not an independent estimate of persistence.
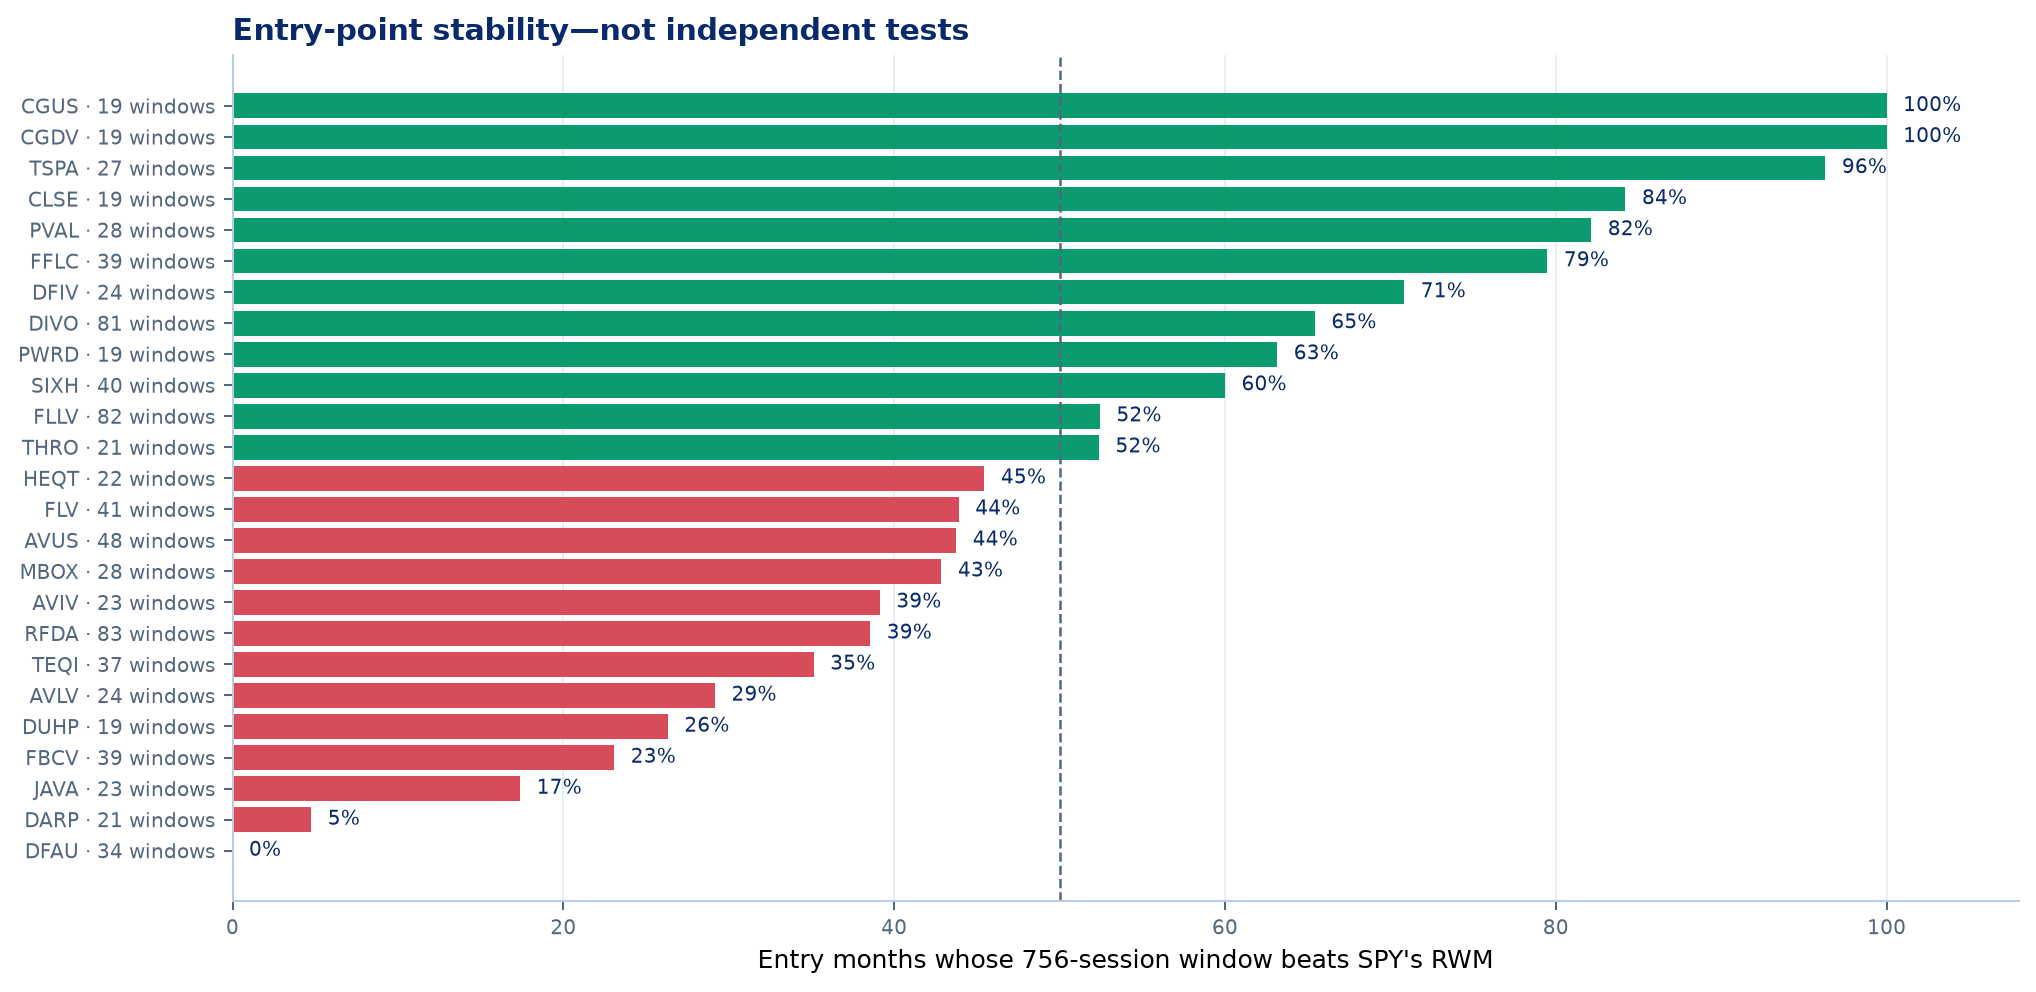
Fraction and share of entry months whose subsequent 756-session window beats SPY's RWM; CAGR remains in the table as context.
| Ticker | Product | Beats RWM | % CAGR | % RWM | % CAGR + RWM | Worst Δ CAGR | Worst Δ RWM |
|---|---|---|---|---|---|---|---|
| CGUS | Capital Group Core Equity ETF | 19/19 | 89.5% | 100.0% | 89.5% | −0.2% | 0.047 |
| CGDV | Capital Group Dividend Value ETF | 19/19 | 100.0% | 100.0% | 100.0% | 1.9% | 0.670 |
| TSPA | T. Rowe Price U.S. Equity Research ETF | 26/27 | 100.0% | 96.3% | 96.3% | 0.3% | −0.071 |
| CLSE | Convergence Long/Short Equity ETF | 16/19 | 84.2% | 84.2% | 78.9% | −0.5% | −0.367 |
| PVAL | Putnam Focused Large Cap Value ETF | 23/28 | 75.0% | 82.1% | 75.0% | −3.2% | −0.779 |
| FFLC | Fidelity Fundamental Large Cap Core ETF | 31/39 | 97.4% | 79.5% | 79.5% | −0.3% | −0.352 |
| DFIV | Dimensional International Value ETF | 17/24 | 62.5% | 70.8% | 62.5% | −5.1% | −0.483 |
| DIVO | Amplify CWP Enhanced Dividend Income ETF | 53/81 | 7.4% | 65.4% | 7.4% | −9.2% | −1.802 |
| PWRD | TCW Transform Systems ETF | 12/19 | 100.0% | 63.2% | 63.2% | 1.3% | −0.874 |
| SIXH | ETC 6 Meridian Hedged Equity Index Option ETF | 24/40 | 10.0% | 60.0% | 10.0% | −13.8% | −3.129 |
| FLLV | Franklin Liberty U.S. Low Volatility ETF | 43/82 | 20.7% | 52.4% | 20.7% | −9.3% | −2.067 |
| THRO | iShares U.S. Thematic Rotation Active ETF | 11/21 | 90.5% | 52.4% | 52.4% | −0.6% | −0.554 |
| HEQT | Simplify Hedged Equity ETF | 10/22 | 4.5% | 45.5% | 4.5% | −9.0% | −1.003 |
| FLV | American Century Focused Large Cap Value ETF | 18/41 | 7.3% | 43.9% | 7.3% | −12.2% | −3.106 |
| AVUS | Avantis U.S. Equity ETF | 21/48 | 37.5% | 43.8% | 33.3% | −3.7% | −1.494 |
| MBOX | Freedom Day Dividend ETF | 12/28 | 35.7% | 42.9% | 35.7% | −9.6% | −2.732 |
| AVIV | Avantis International Large Cap Value ETF | 9/23 | 30.4% | 39.1% | 30.4% | −6.4% | −0.646 |
| RFDA | ALPS Dynamic US Dividend Advantage ETF | 32/83 | 27.7% | 38.6% | 27.7% | −6.3% | −2.055 |
| TEQI | T. Rowe Price Equity Income ETF | 13/37 | 13.5% | 35.1% | 13.5% | −11.7% | −3.186 |
| AVLV | Avantis U.S. Large Cap Value ETF | 7/24 | 25.0% | 29.2% | 8.3% | −7.1% | −2.406 |
| DUHP | Dimensional US High Profitability ETF | 5/19 | 10.5% | 26.3% | 10.5% | −4.9% | −1.195 |
| FBCV | Fidelity Blue Chip Value ETF | 9/39 | 12.8% | 23.1% | 12.8% | −13.4% | −3.552 |
| JAVA | JPMorgan Active Value ETF | 4/23 | 4.3% | 17.4% | 4.3% | −10.0% | −2.883 |
| DARP | Grizzle Growth ETF | 1/21 | 76.2% | 4.8% | 4.8% | −5.2% | −1.586 |
| DFAU | Dimensional US Core Equity Market ETF | 0/34 | 0.0% | 0.0% | 0.0% | −1.4% | −0.797 |
Synthesis and contrast
9One decision criterion, one complementary descriptor
RWM orders the comparison with SPY; CAGR keeps economic magnitude visible. DBF± does not select winners in this study: it describes whether net return direction is supported by breadth.
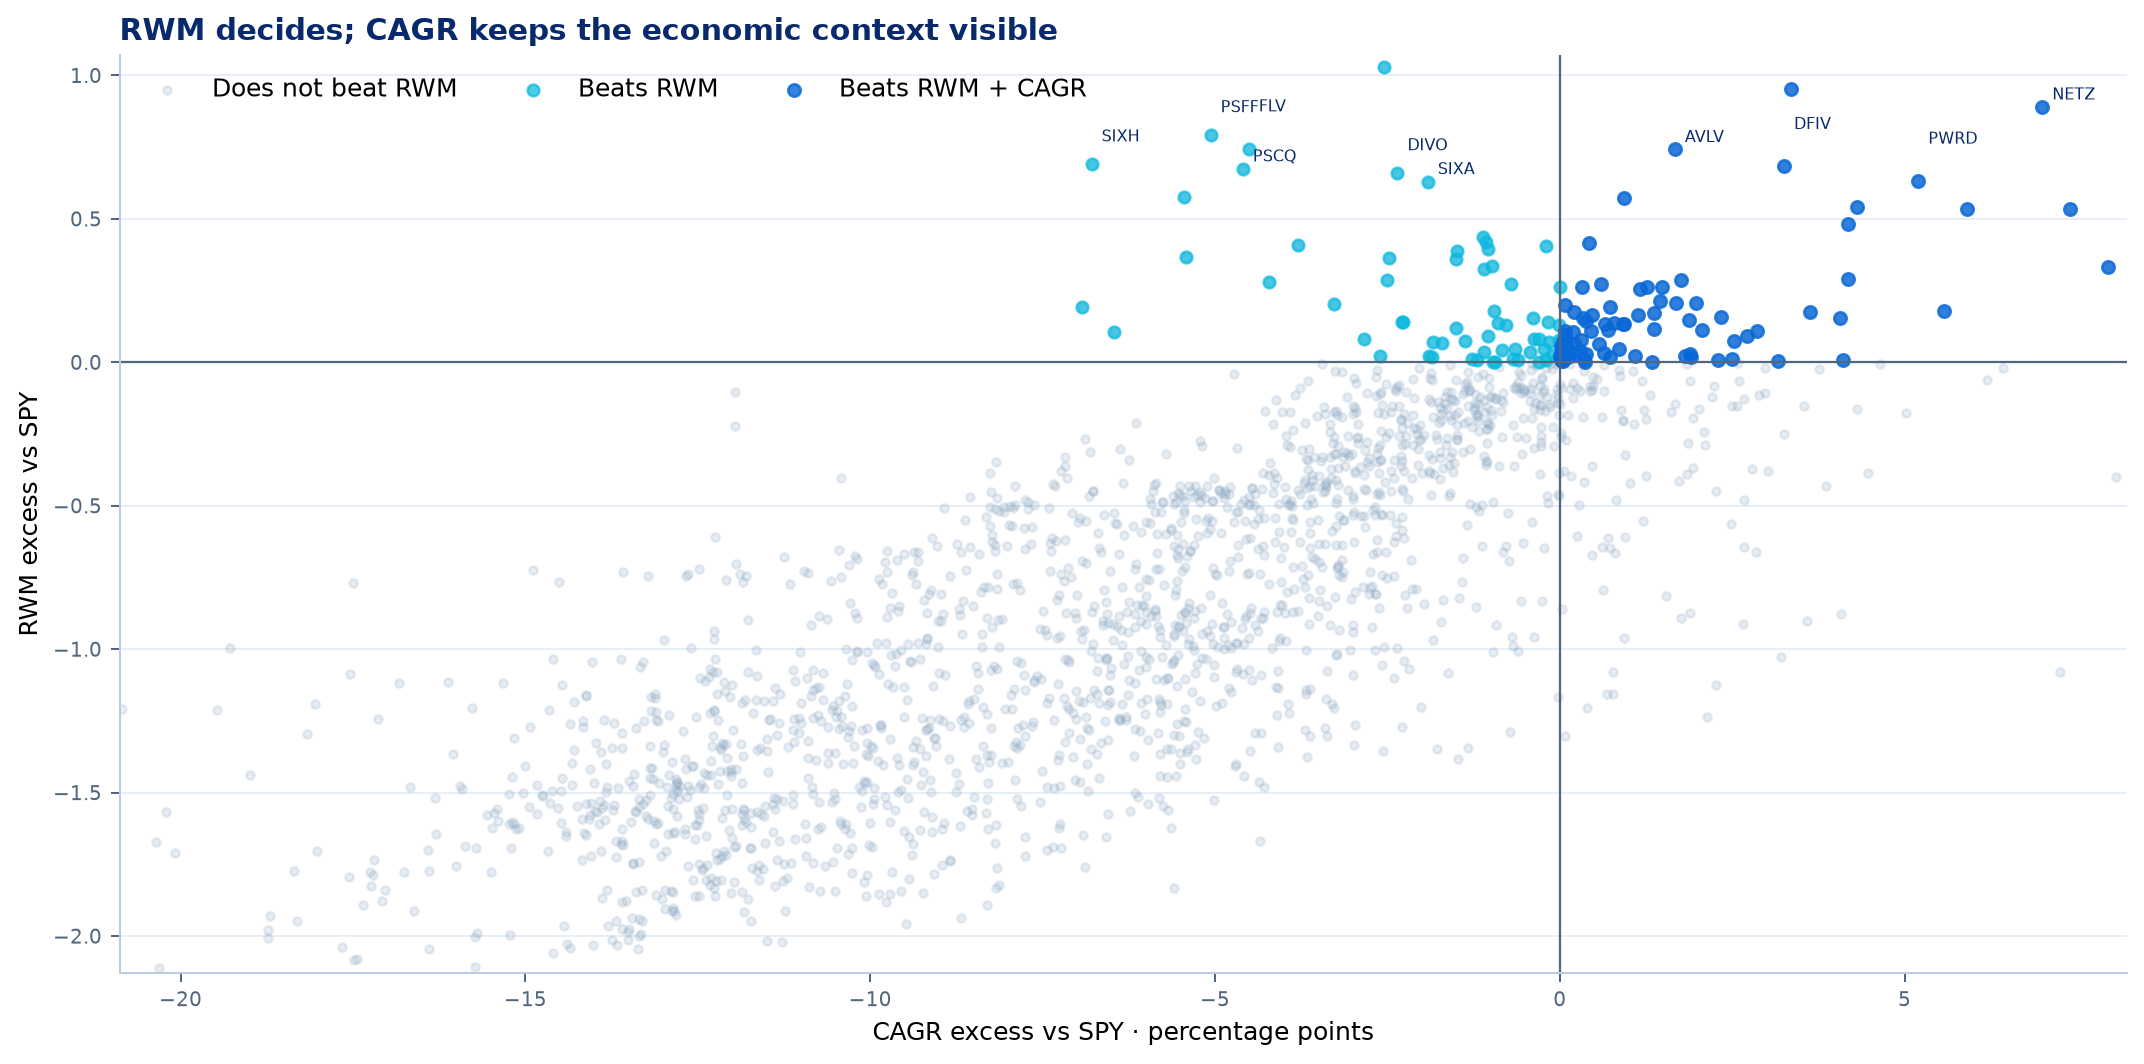
The 156 points above zero on RWM beat SPY under the primary criterion; 89 also lie to the right of zero on CAGR. Visual limits trim extremes, but counts use every observation.
156 beat RWM
7.8% of the universe has a higher RWM than SPY over its comparable window.
89 beat RWM + CAGR
4.4% preserves the relative advantage and also finishes with higher annualised growth.
The fifteen largest RWM advantages
| Ticker | Product | Process | CAGR | SPY CAGR | RWM | SPY RWM | Δ RWM | Beats CAGR |
|---|---|---|---|---|---|---|---|---|
| FFLC | Fidelity Fundamental Large Cap Core ETF | Identified active | 19.6% | 16.7% | 3.421 | 1.559 | 1.862 | Yes |
| PSMJ | Pacer Swan SOS Moderate (July) ETF | Identified non-index management | 10.5% | 13.2% | 2.621 | 0.989 | 1.633 | No |
| BALT | Innovator Defined Wealth Shield ETF | Identified non-index management | 6.0% | 13.4% | 2.586 | 1.006 | 1.580 | No |
| PVAL | Putnam Focused Large Cap Value ETF | Identified active | 16.8% | 13.7% | 2.572 | 1.063 | 1.509 | Yes |
| PSMO | Pacer Swan SOS Moderate (October) ETF | Identified non-index management | 10.4% | 14.1% | 2.489 | 1.039 | 1.450 | No |
| PSFO | Pacer Swan SOS Flex (October) ETF | Identified non-index management | 11.7% | 13.8% | 2.386 | 1.007 | 1.379 | No |
| RISR | FolioBeyond Alternative Income and Interest Rate Hedge ETF | Identified non-index management | 13.9% | 13.8% | 2.383 | 1.007 | 1.376 | Yes |
| PSFJ | Pacer Swan SOS Flex (July) ETF | Identified non-index management | 11.4% | 13.4% | 2.370 | 1.006 | 1.365 | No |
| CLSE | Convergence Long/Short Equity ETF | Identified active | 20.3% | 15.3% | 2.635 | 1.289 | 1.346 | Yes |
| PSFD | Pacer Swan SOS Flex (January) ETF | Identified non-index management | 12.8% | 15.4% | 2.340 | 1.312 | 1.028 | No |
| CGDV | Capital Group Dividend Value ETF | Identified active | 18.7% | 15.4% | 2.252 | 1.298 | 0.954 | Yes |
| NETZ | Engine No. 1 Transform Climate ETF | Identified non-index management | 20.1% | 13.1% | 1.909 | 1.019 | 0.890 | Yes |
| PSFF | Pacer Swan SOS Fund of Funds ETF | Identified non-index management | 10.1% | 15.2% | 2.082 | 1.288 | 0.793 | No |
| BOAT | SonicShares Global Shipping ETF | Identified index/passive | 28.2% | 13.2% | 1.742 | 0.971 | 0.771 | Yes |
| FLV | American Century Focused Large Cap Value ETF | Identified active | 16.1% | 20.6% | 2.785 | 2.041 | 0.744 | No |
The ten highest DBF± profiles
| Ticker | Product | CAGR | DBF± | D± | J |
|---|---|---|---|---|---|
| SGOV | iShares 0-3 Month Treasury Bond ETF | 2.9% | 0.383 | 0.860 | 0.445 |
| BILS | State Street SPDR Bloomberg 3-12 Month T-Bill ETF | 2.9% | 0.325 | 0.748 | 0.435 |
| BKUI | BNY Mellon Ultra Short Income ETF | 3.5% | 0.249 | 0.465 | 0.536 |
| VUSB | Vanguard Ultra-Short Bond ETF | 3.3% | 0.172 | 0.333 | 0.517 |
| TBUX | T. Rowe Price Ultra Short-Term Bond ETF | 4.0% | 0.166 | 0.315 | 0.525 |
| SHV | iShares 0-1 Year Treasury Bond ETF | 1.6% | 0.164 | 0.441 | 0.372 |
| GBIL | Goldman Sachs Access Treasury 0-1 Year ETF | 2.3% | 0.148 | 0.566 | 0.261 |
| GSST | Goldman Sachs Ultra Short Bond ETF | 3.2% | 0.138 | 0.377 | 0.367 |
| CLTL | Invesco Treasury Collateral ETF | 2.4% | 0.128 | 0.540 | 0.236 |
| TBLL | Invesco Short Term Treasury ETF | 2.4% | 0.124 | 0.543 | 0.228 |
The universe as a whole
10SPY does not merely beat the average—it finishes high in the distribution
Every ETF is rebased to 100 on 1 March 2022. The fan displays the full dispersion of buy-and-hold wealth; the second figure separates mean, median and coverage sensitivity. Neither represents a rebalanced portfolio.
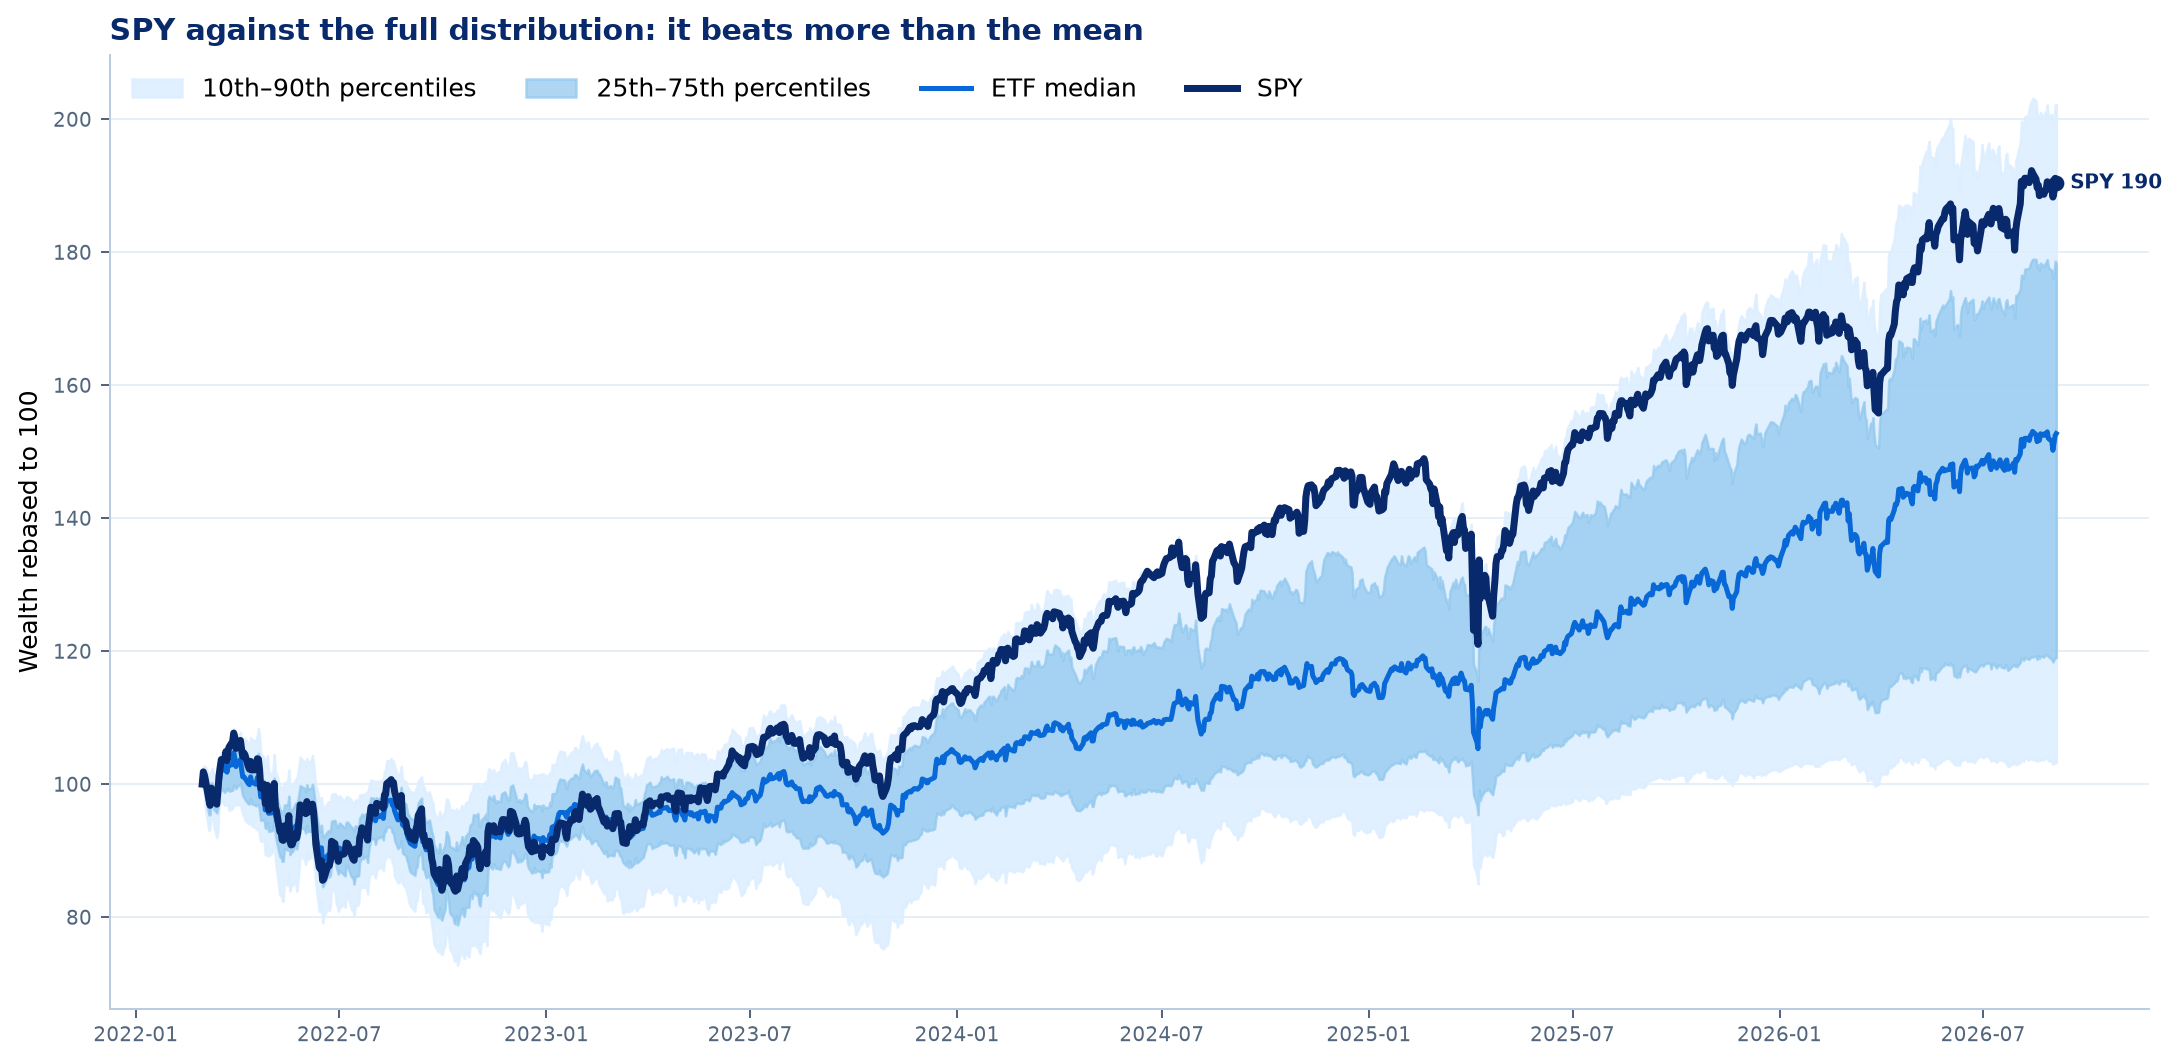
Cross-sectional bands for 1,935 products with complete coverage. The fan shows the centre, dispersion and extremes at the same time.
The mean tells the same story
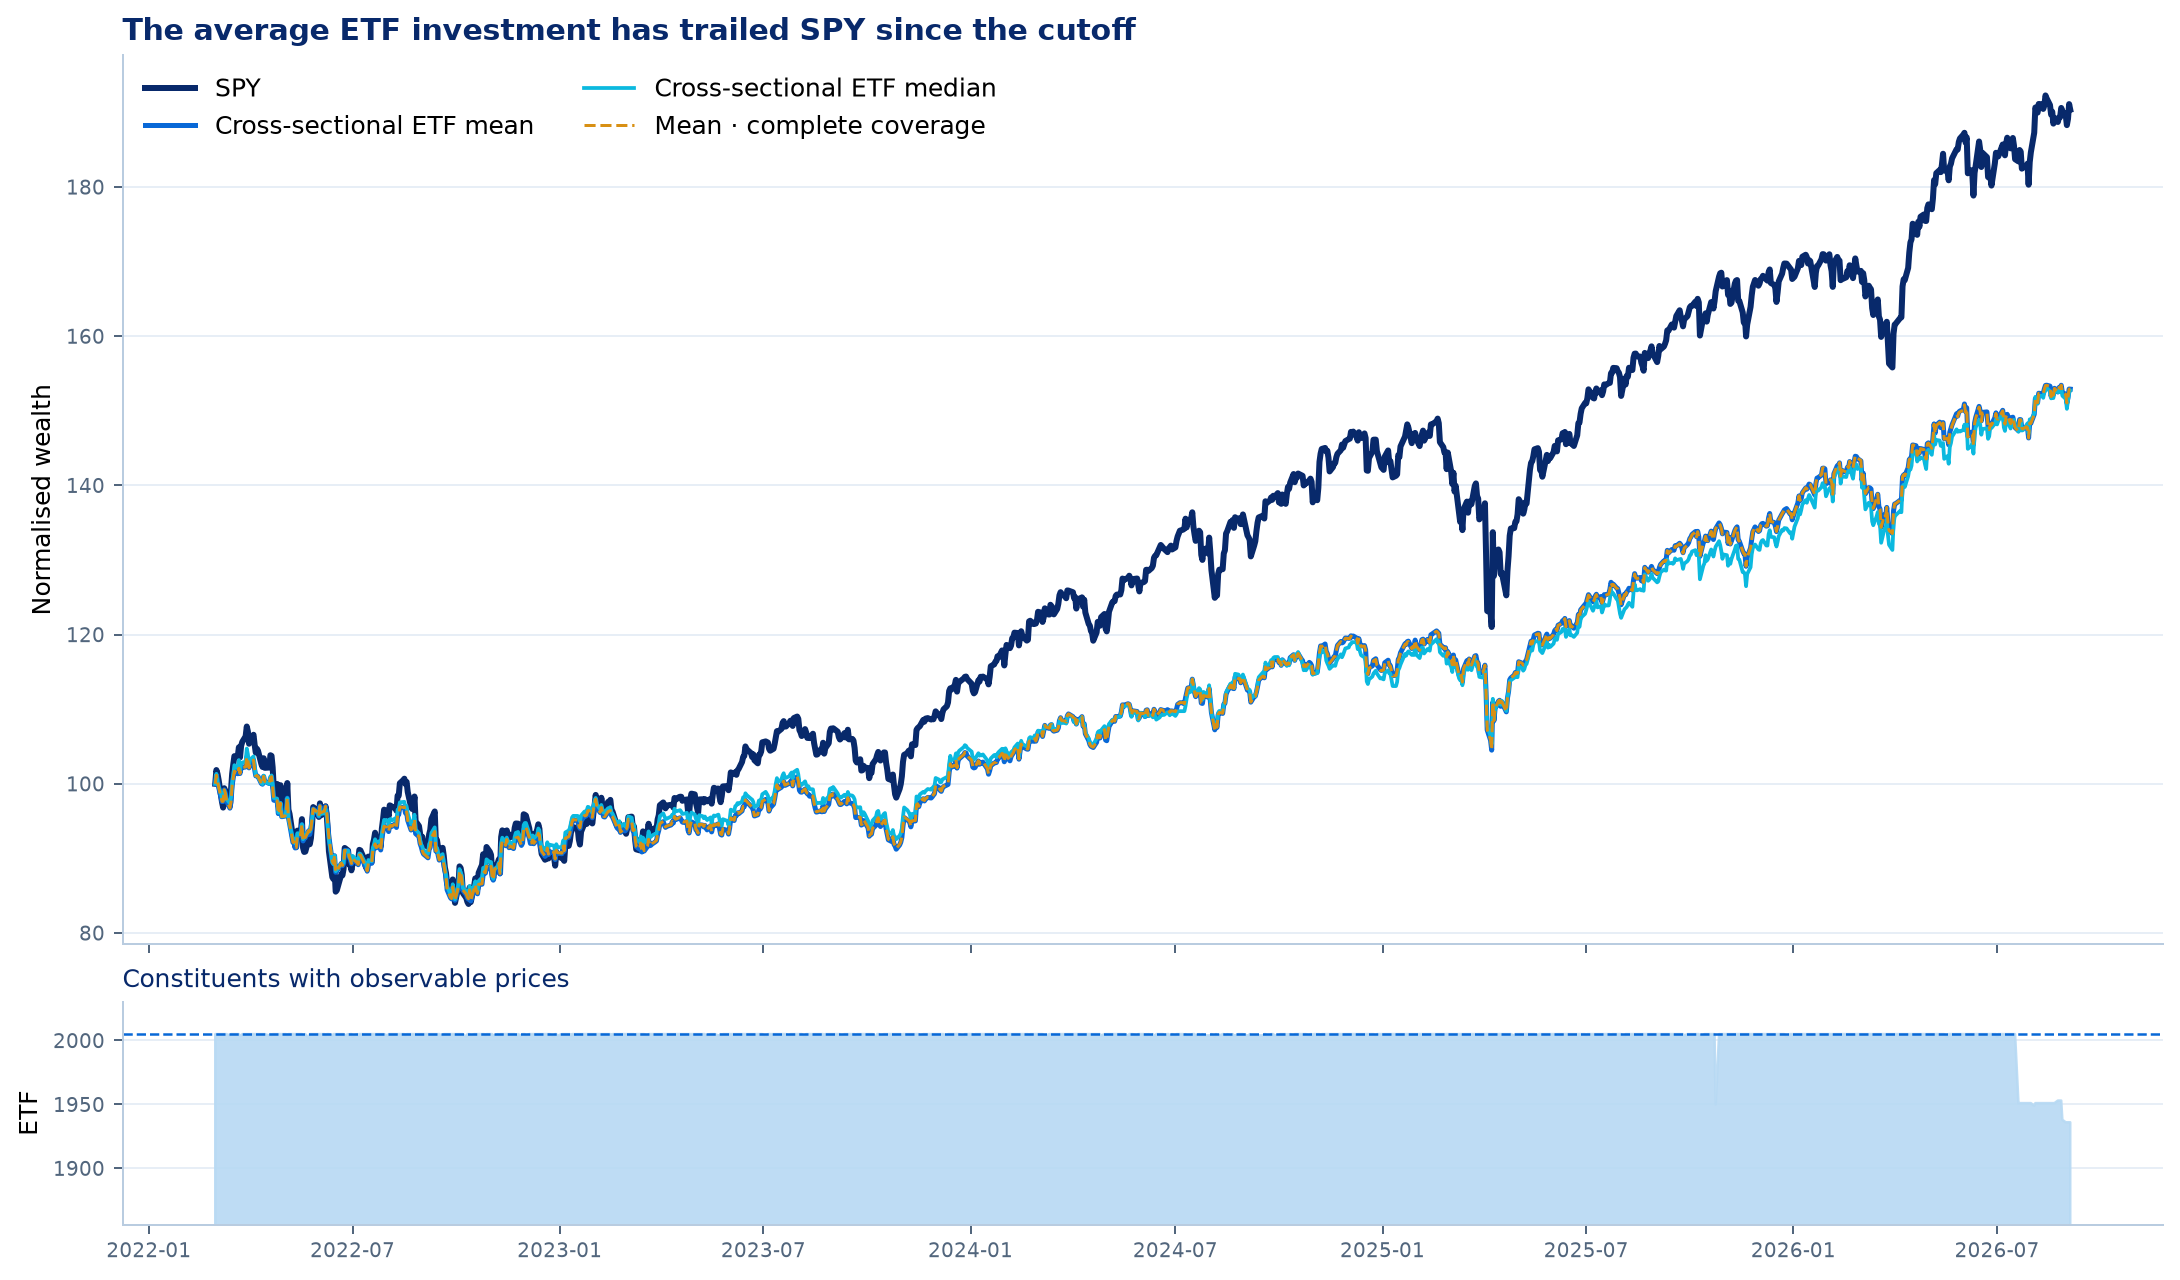
The complete-coverage sensitivity requires at least 98.5% observable sessions through the end.
Qinvia verdict
11Simple does not mean easy to beat
What the evidence does show
- Only 7.8% of the universe beats SPY's RWM.
- Only 4.4% beats RWM and CAGR simultaneously.
- Most attributable winners reflect beta exposure, not demonstrated management skill.
- 25 of 217 intentional-management products beat RWM; 12 do so from a majority of entry points.
- After return matching and financing, 8 of 11 feasible cases preserve RWM.
Why the bar is structurally high
- The S&P 500 already diversifies hundreds of profitable, liquid businesses.
- Capitalisation weighting lets winners grow and mechanically reduces the weight of losers.
- Its membership renews; it is not a static portfolio of the companies selected in 1957.
- SPY packages that exposure with deep liquidity, low cost and little operational friction.
- A more complex product therefore carries the burden of showing what improves—and whether the improvement persists.
One explanation consistent with the literature is that alpha has finite capacity. Strong results attract assets under management; deploying larger positions across a limited opportunity set can increase market impact, costs, liquidity constraints and competition, eroding the edge that attracted the flows. Berk and Green (2004) formalise this equilibrium; Chen et al. (2004) find a more adverse size relationship among funds exposed to small and illiquid stocks, while Pástor, Stambaugh and Taylor find strong decreasing returns at the industry level but less conclusive evidence at the individual-fund level.
The counterpoint matters. Using real institutional trades, Frazzini, Israel and Moskowitz estimate far greater capacity than previously assumed for some strategies and show that cost-aware execution can expand it substantially. Capacity depends on turnover, horizon, liquidity, market breadth and execution. Our ETF data do not causally identify the effect of flows or estimate the capacity of each process; this mechanism is therefore presented as a plausible explanation, not a demonstrated conclusion.
Quality control and limits of free data
We validated 5,505 Parquet files without integrity failures. The catalogue preserves historical identities, but the 67 non-current series all reach recent dates and do not represent liquidations distributed through time. Survivorship bias remains a material limitation. RWM uses DFF as idealised institutional cash—daily accrual, no spread, Actual/360—and does not represent a guaranteed retail return. Management style is audited for every product using SEC N-CEN and documented primary sources; no row remains unassigned.
Generated 2026-09-09 21:15 UTC. Data through 04 Sep 2026. Primary source: free Yahoo Finance · daily Adj Close · exact dates shared with SPY. Cash: FRED DFF.
GitHub
Methodology, notebooks and reproducible materials.
The public repository preserves the bilingual notebooks, methodology and derived materials. This web publication retains the complete figures, formulas, charts, tables, limitations and conclusion.
GitHub Code and reproduction