
Qinvia Research · Market history
The 10% annual return: a true story, not a law
What the celebrated US stock-market average actually measures—and what history, missing markets and thirty-year horizons say about using it as a forecast.
Core idea. The 10% annual return of US equities is a real historical figure. That does not make it a universal law of investing or a forecast. The lesson is not to avoid equities; it is to distinguish what happened, what might have happened, and what a portfolio must be able to endure.
London, 1900. Imagine an investor opening the financial press before deciding how much of her savings to commit for decades. We do not know who she is; that is the point. Nor can she know which country will pass through wars, regime changes, inflation, innovation, and decades of sufficient stability for compounding to do its work.
The United States is already an important market. But the world equity map is far more dispersed than it will be a century later. The question is not what this imagined investor should have chosen. It is to recognize that, at her starting date, several futures looked possible—and none came labeled “the history we will later teach.”
Move forward to today. The surviving sentence is neat and reassuring: “the stock market returns 10% a year in the long run.” It contains a historical truth. It also compresses one country, one period, one return measure, and one sequence of events that will not recur in the same way. Before turning it into a personal expectation, it deserves its surnames back.
1The number is real
The public summary of the UBS Global Investment Returns Yearbook 2026 puts the annualized return on US equities from 1900 through 2025 at 9.8% nominal, with dividends reinvested. After inflation, the result is 6.6% real per year.
Both numbers are remarkable. They also describe different things.
- Nominal means current dollars: it does not remove the rise in the cost of living.
- Real means purchasing power: it is closer to what matters for a future spending goal.
- Total return includes reinvested dividends. It is not the same thing as a price chart for an index.
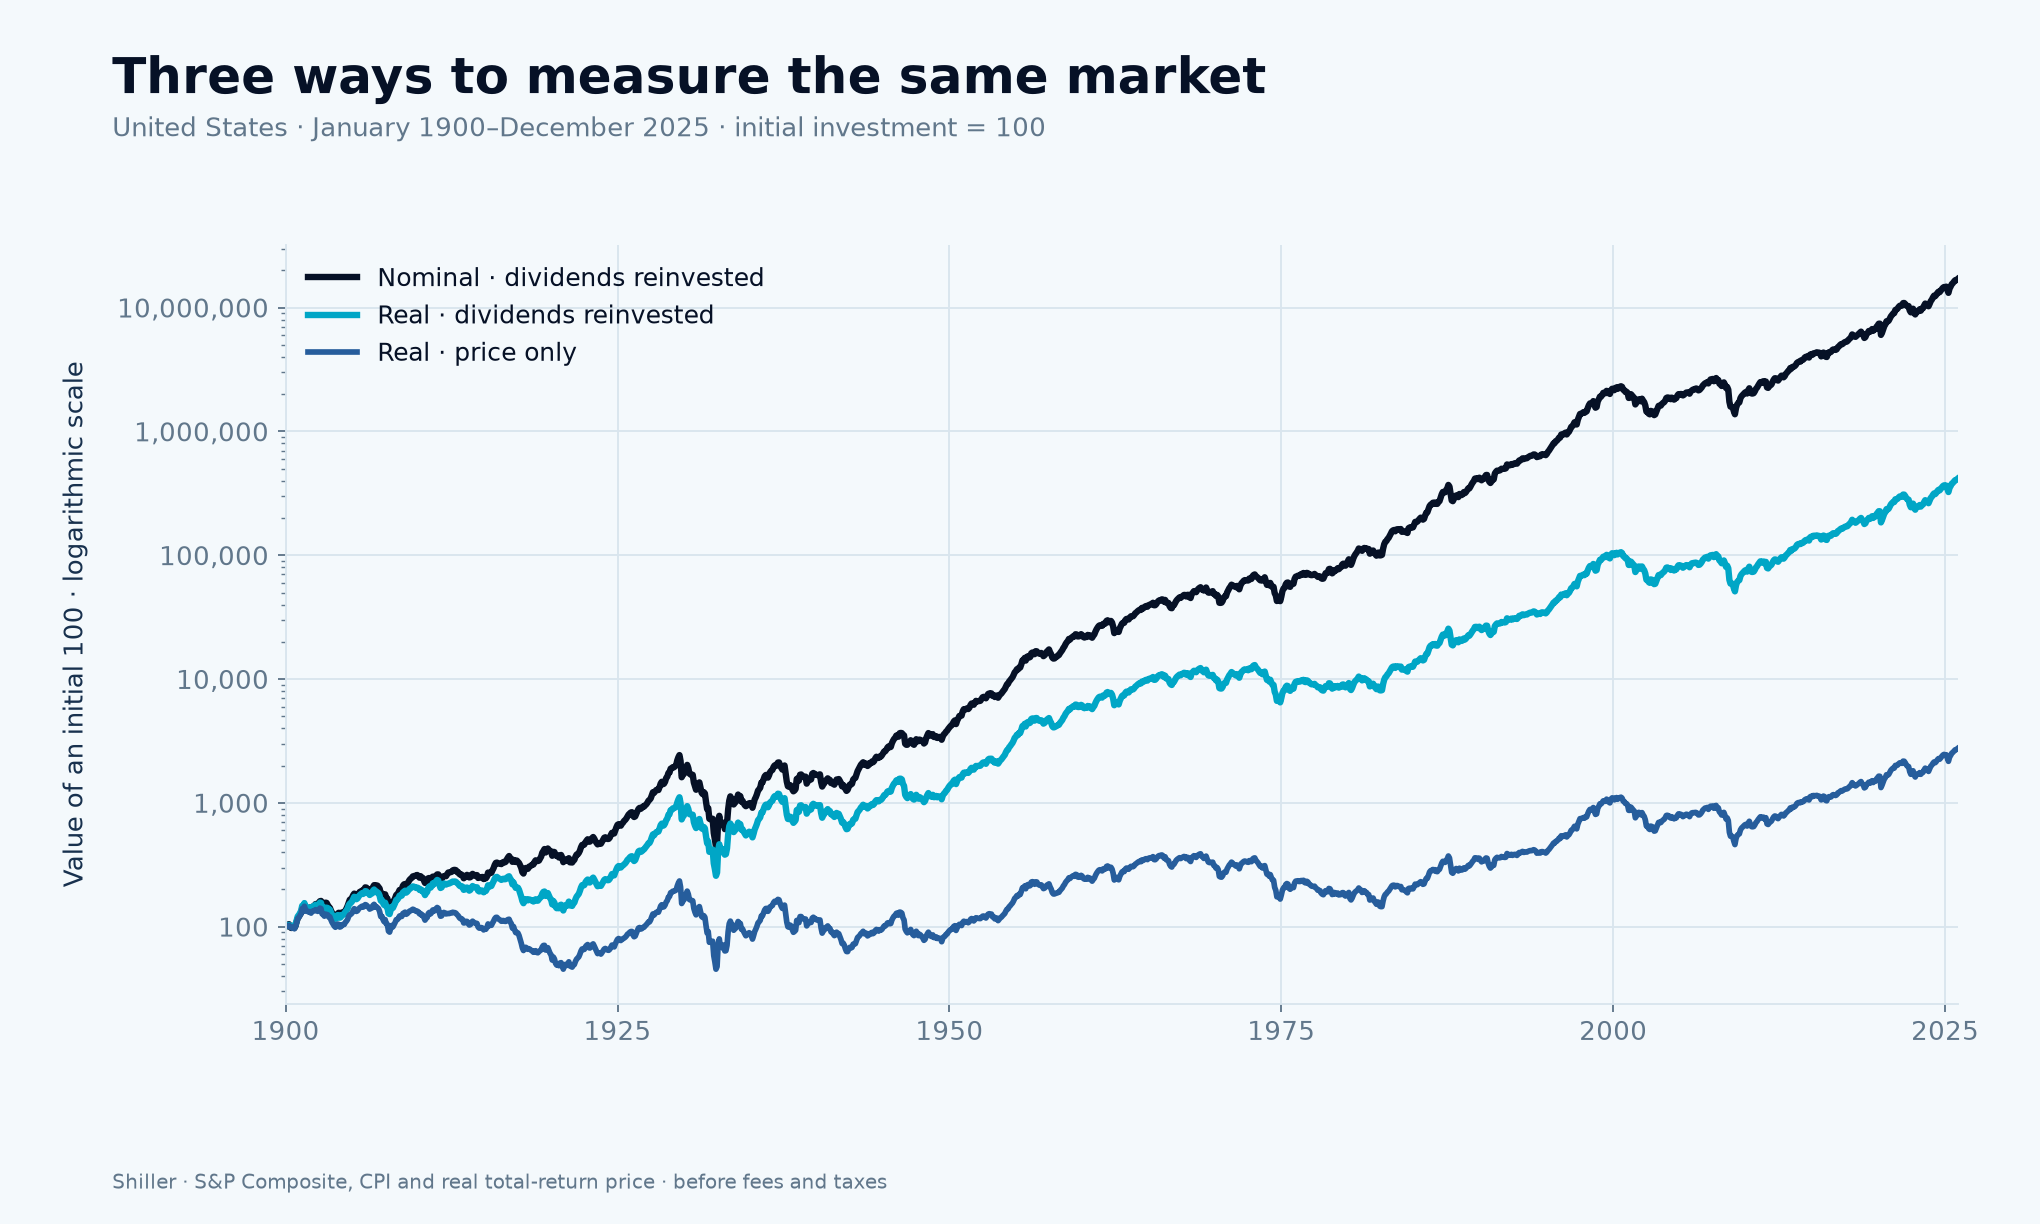
That contrast does not diminish the success story; it makes it legible. The same report estimates that one dollar invested in US equities at the start of 1900 grew to 124,854 nominal dollars by the end of 2025. In purchasing-power terms, the real equity index reached 3,296. The gap between those curves is not a technical footnote. Inflation and reinvestment are part of the result.
The first figure makes that distinction visible without asking us to choose a convenient version. In Robert Shiller’s monthly reconstruction, from January 1900 to December 2025, annualized nominal total return is 10.03%, real total return is 6.84%, and real price return is 2.66%. These are not rival answers: dividends explain one separation and inflation another. Nor are they a reproduction of UBS. Index, deflator, and source data differ, so Shiller’s figures need not exactly match UBS’s 9.8% and 6.6%.
There is an important historical correction here. The United States was not a small market in 1900. It was already a major share of quoted global capital. What changed extraordinarily is the scale of its dominance: UBS estimates that it now accounts for about 62% of global equity market value. The past should not be rewritten as if the American outcome was obvious, or as if the country started from irrelevance. It was important; it became dominant.
2Looking only at the markets still on screen
Abraham Wald’s story is a parable about selection, not a financial proof. Wald studied how to infer aircraft vulnerability from those that returned: the survivor sample left out precisely the potentially lethal hits.
A market is not a bomber, and the parable does not automatically turn every stock-market history into survivorship bias. It helps ask a better question: when we observe mainly markets with long, continuous series, what part of the history sits outside the sample? That question needs data and method. That is why Jorion and Goetzmann follow the parable.
Philippe Jorion and William Goetzmann took up that question in Global Stock Markets in the Twentieth Century. They reconstructed returns for 39 markets from 1921 to 1996 and documented breaks in the series. For that window, the United States’ real geometric price return was 4.32% per year; the median across the 39 markets was 0.75% per year. These are national histories of unequal length and they exclude dividends. The median describes the position of a typical country in the sample; it does not describe the return of an investable world portfolio.
That counterpoint changes the reading without erasing the first observation. In the same study, the GDP-weighted world price index built with all markets—including losses imputed by the method for permanent breaks—returned 4.04% real per year, against 4.32% for the United States. That global portfolio is not equivalent to a country median, and it is not a total-return series either. Both views matter: the United States stood above most national markets; a weighted global portfolio had an experience materially closer to the US result than that median suggests.
Our second figure does not attempt to recalculate that ranking. It shows something that comes before it: the numerical availability of the received file. That availability does not prove that a market was open or that its quotation was continuous: the file contains positive reconstructed or bridged values for Germany and Japan during their 1944–49 interruptions. Of the 39 markets, seven series end before December 1996. A further 426 non-positive observations appear in seven markets; a price index cannot take those values, so the figure marks them as invalid data, not as falls or losses. It is a file-coverage-and-quality figure, not a verdict on survival. An available value does not demonstrate market continuity; an absence does not demonstrate a loss.

3A plan can fail without a single cinematic disaster
When people discuss survivorship bias, it is tempting to reduce history to a simple scene: a country disappears, a market is treated as a total loss, one event explains everything. Financial reality is usually more intricate. Market interruptions, nationalizations, currency conversions, hyperinflations, and reopenings can affect assets and investors differently. We do not need to turn every historical episode into an absolute claim to recognize the risk.
Nor do we need to leave the United States to find demanding stretches. Equities can produce a strong long-run result while making an investor who arrives at a bad moment wait. The third figure fixes three real Shiller entry dates: September 1929, December 1968, and August 2000. With dividends reinvested, the first later cross back to the entry-month value arrives after 7.17, 3.92, and 12.75 years, respectively. Looking only at real price, the wait changes to 29.17, 23.08, and 14.25 years. This is not a presentational detail. It is the difference between holding a quotation and holding total return.
The first cross does not promise that the recovery will last, nor does it describe a portfolio with costs, taxes, or contributions. But it gives the phrase “the long run” its proper scale: even within the US series, the path matters as much as the average.
Japan remains useful if it is not asked to carry a conclusion it cannot support. The price-only Nikkei 225 exceeded its December 1989 nominal high in February 2024. That does not date the recovery of an individual portfolio and it is not part of our figure; dividends, inflation, currency, taxes, contributions, and the exact index held all matter. It is neither a forecast nor an equivalence to the United States.

4The honest debate does not end with bias
There is a responsible version of the optimistic case. The global history assembled by Dimson, Marsh, and Staunton and summarized by UBS spans 35 markets, and finds that equities outperformed bonds, bills, and inflation in countries with continuous investment histories. The report also finds that global diversification has been valuable for the vast majority of markets studied, even as concentration and higher correlations have made diversification more difficult.
That matters. This article does not argue that equities lack a risk premium, that US data are an error, or that diversification removes all risk. Its claim is more modest: a very strong historical return does not remove uncertainty about the next sequence of returns.
The fourth figure returns to the United States, this time without choosing an entry year. It runs through 1,152 overlapping monthly 30-year windows in the Shiller series. None end with a negative real total return; 153 of 1,152 do when only real price is considered. The comparison says something specific about this US sample and two different measures. It does not create 1,152 independent experiments, predict the future, or prove that the next 30-year window will be positive.
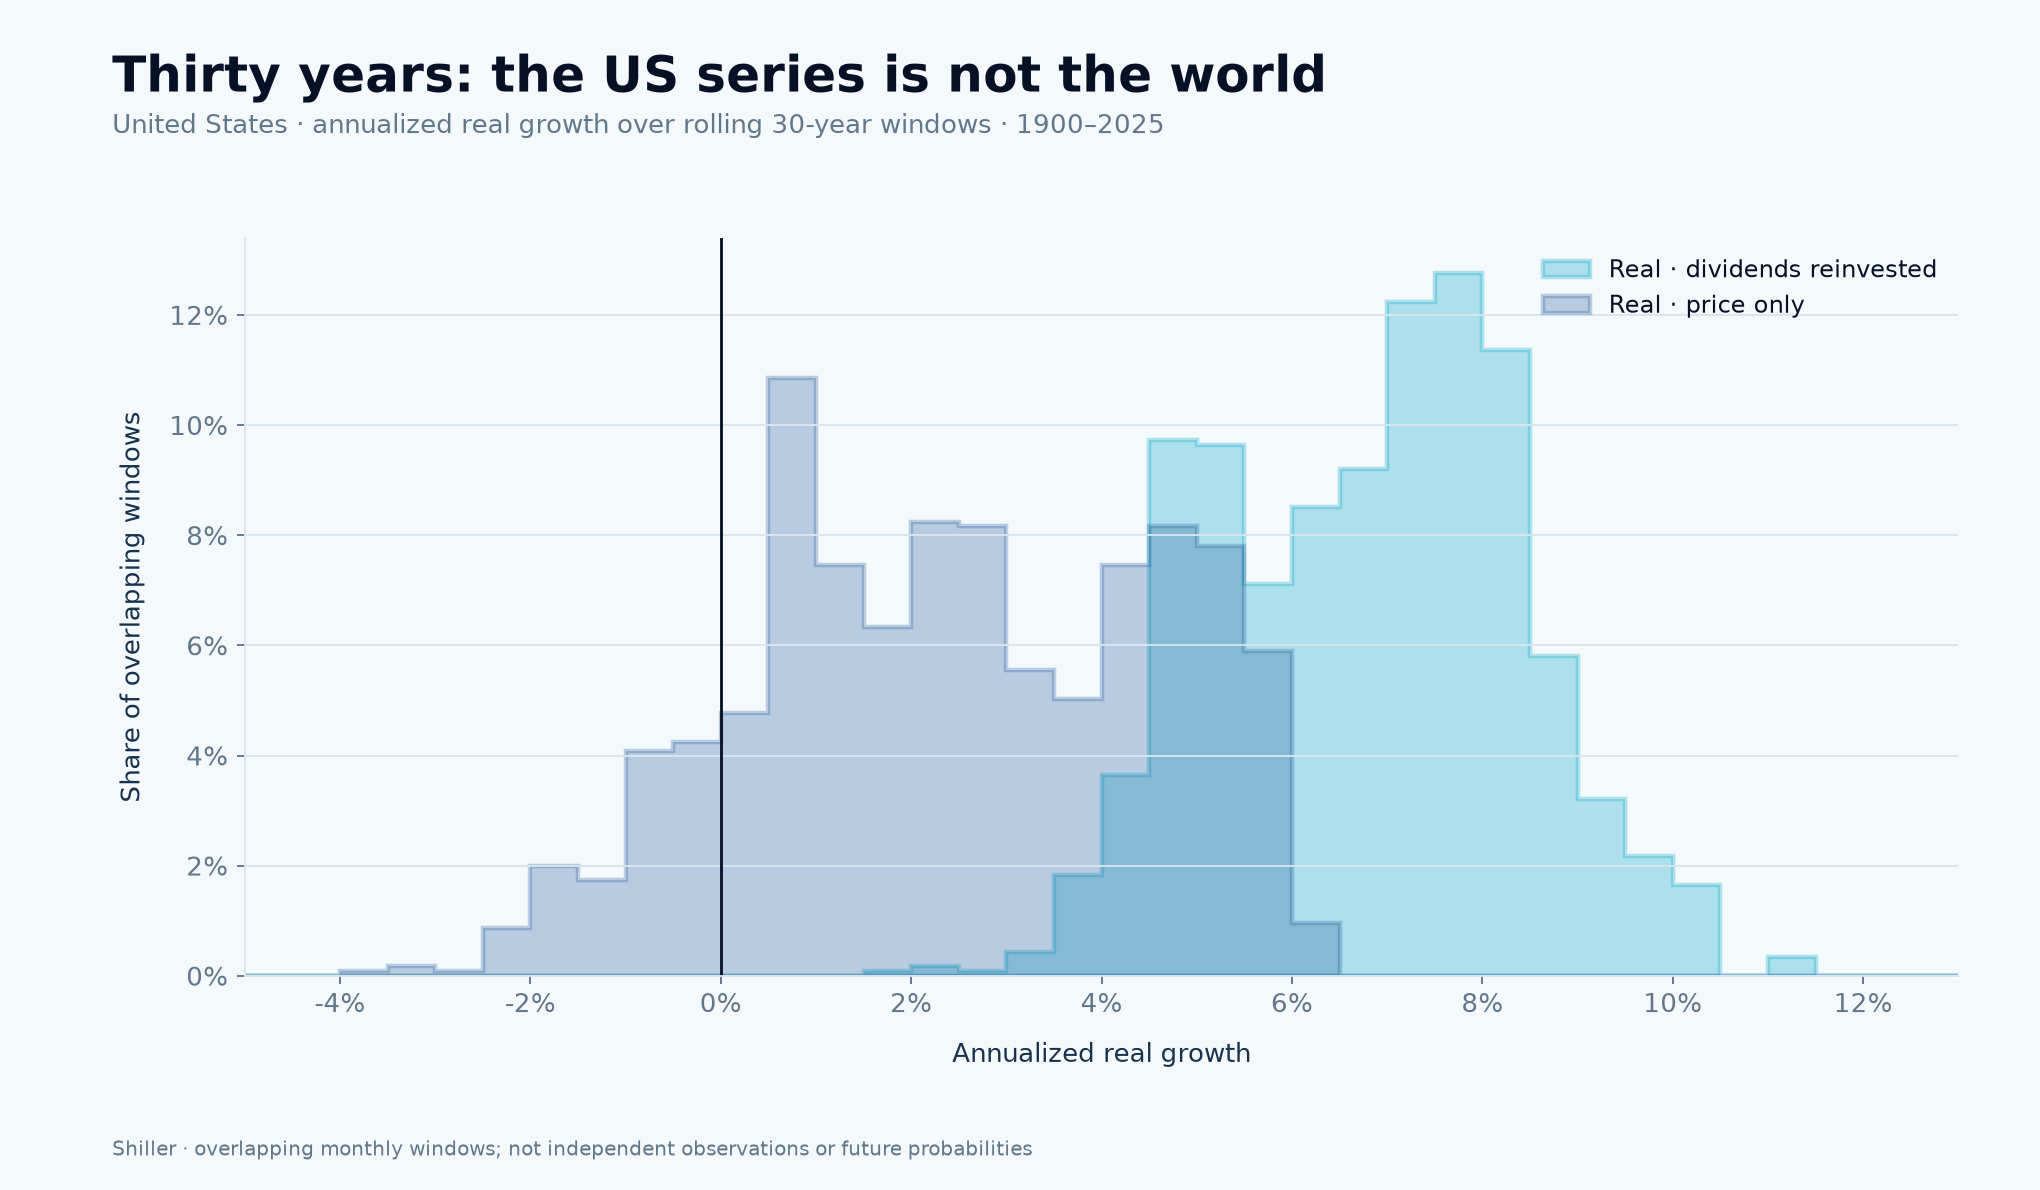
Research by Anarkulova, Cederburg, and O’Doherty asks a different question, which is why it does not contradict that figure. Using the same resampling method, it estimates for a diversified investment within one domestic market a 12.1% chance of ending below inflation after 30 years when developed markets are used, versus 1.2% when the inference is limited to the United States. It is neither the result for a global portfolio nor the percentage in our Shiller windows. Nor is it an exact personal probability for 2026: it depends on the sample and resampling method. What that gap shows is how much the conclusion can change when the historical universe changes: “a lot of time” does not automatically turn equities into a real guarantee.
5What a sensible investor can do with this
The response is neither to sell out in fear nor to hunt for the next winning country. It is to build a process that does not depend on one historical number repeating.
First, separate an expectation from a promise. A financial plan can use prudent assumptions, ranges, and scenarios. The US return from 1900 to 2025 is a reference point, not a contract for the decades ahead.
Second, measure goals in real terms. Retirement, education, and future spending are paid for with purchasing power. Looking at real total return does not guarantee an outcome, but it prevents a nominal rise from being mistaken for economic progress.
Third, diversify deliberately. Diversifying is not a claim to know which country will win. It is an admission that we do not. Nor is it a magic solution: the United States’ current share of global market value means a global portfolio already has a large US exposure. Knowing that makes it a decision, rather than a surprise.
Fourth, design for behavior. If a strategy only works for an investor who does not sell during a difficult decade, that decade is part of the strategy. Liquidity for near-term needs, an appropriate risk level, and pre-committed rebalancing rules can matter as much as an elegant return assumption.
Fifth, consider jurisdiction as well as tickers. Custody, currency, legal framework, and concentration of wealth are decisions distinct from selecting companies. Market history does not provide an infallible manual; it does show that these layers exist.
6Closing
The 10% annual figure is not a lie to debunk. It is a truth that needs surnames: American, historical, nominal, and total return. Adding them does not make equities less interesting. It makes them a tool that can be understood more precisely.
The best reading of the evidence is not “do not invest.” It is “do not confuse an extraordinary past outcome with a law of nature.” Investing with that distinction does not promise less. It demands a more honest promise.
This article is research and general education, not investment advice or an assessment of an individual portfolio.
Sources
- UBS Global Investment Returns Yearbook 2026 — Public summary
- Jorion and Goetzmann, “Global Stock Markets in the Twentieth Century”
- Anarkulova, Cederburg, and O’Doherty, “Stocks for the Long Run? Evidence from a Broad Sample of Developed Markets”
- Robert J. Shiller historical data
- Abraham Wald, “A Method of Estimating Plane Vulnerability Based on Damage of Survivors”
- Nikkei Indexes, March 2024 newsletter
Keep exploring
A number needs context
Original sources are linked in the text and at the end. All four figures are original calculations and visualizations; each caption separates prices, dividends, inflation, period and limitations. Past returns are no promise, but a more precise reading of the past helps us ask better questions.
Back to Research