
Research note · Event study
Anthropic is preparing an IPO. Join the offer, buy at debut or wait?
ANT's proposed IPO raises three different entry points and offers no automatic answer. Airbnb, ARM and UBER show why the starting price matters; 16 mega IPOs put the headlines in context.
Ahead of a possible Anthropic IPO
If Anthropic (ANT) goes public, excitement will arrive before the results. What would you make of the day-one headline?
The company has begun its offering process and proposes a $70–78 range, but there is no final offer price or first close yet. If ANT interests you, at least three situations differ: receiving shares at the offer price, buying after trading begins or waiting to see what follows. The first requires an allocation; the others will have prices we do not know today.
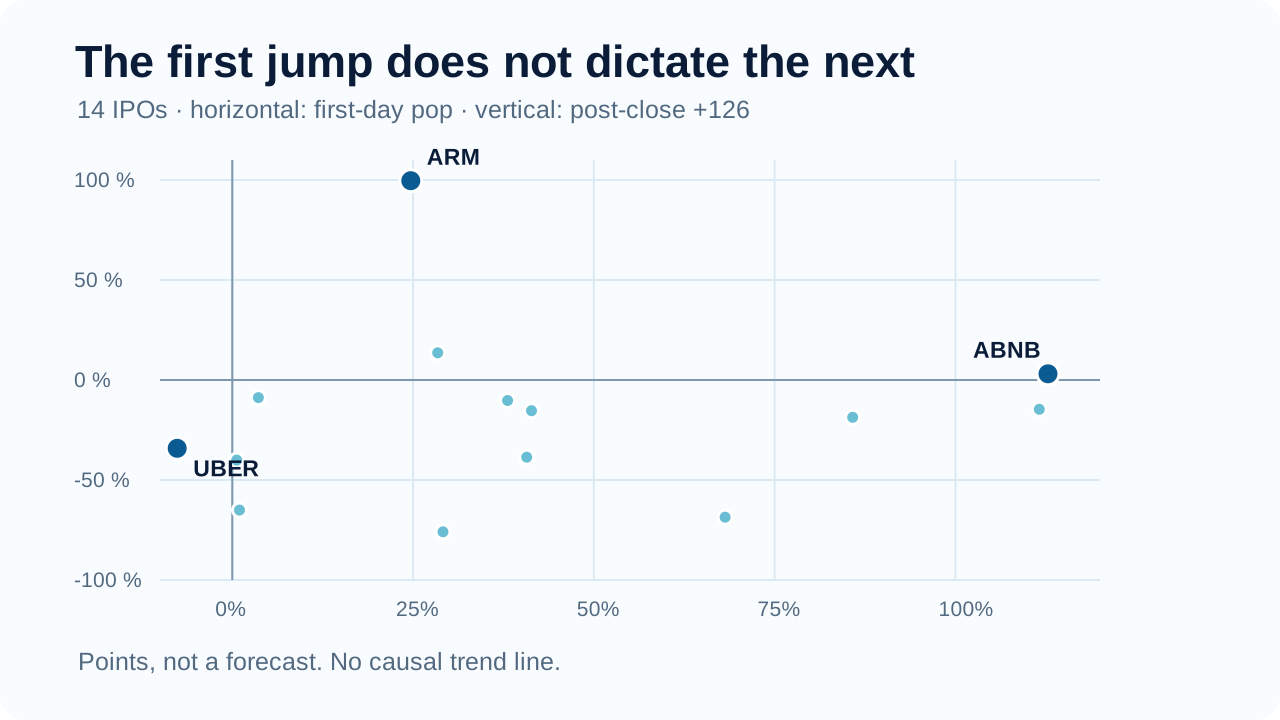
History helps put those choices in perspective. Airbnb closed its debut 112.8% above its offer price. Anyone buying at the first close arrived after that jump. Over the next 126 trading sessions — roughly six months on the market — the stock gained 3.1% from that close; from the offer to the same date, the cumulative gain was 119.4%. Both figures are right, but they describe different experiences.
Three situations for ANT
1Offer, debut or wait: three different decisions.
The first jump, often called the pop, runs from the final offer price to the nominal close on debut day, D0. Getting the offer price requires an allocation in the offering. The second journey starts at D0 and follows the adjusted share price: it asks what happened after the first close. Buying at that exact closing price is a measurement convention, not a guaranteed execution.
Only investors allocated shares can enter at this price. The study measures the move from there to the first close.
Buying after trading starts can happen at different prices. To compare episodes, we use the first close as the starting point.
Entering days or months later means another price. The medians in Figure 2 show what happened from D0, not the return on a later purchase.
Today ANT has only a proposed $70–78 range. Later we explain why that range is not yet the final offer price.
For someone considering ANT after its debut, Airbnb is no universal rule. ARM makes a striking counterpoint: it rose 24.7% from the offer to its first close, then another 99.7% from that close to session +126. UBER fell in both legs: −7.6% and −34.1%. The pop alone tells you nothing certain about what comes next.
Swipe to see the full chart →
Before looking at the results
2What counts as a “major IPO” here?
The study did not pick the debuts that attracted the most attention after rising or falling. It combined two candidate lists before calculating returns. Of 21 names, 16 met the definition: the first traditional IPO of an operating company on a US exchange, with either a base offering of at least $3 billion or an offer-price market capitalisation of at least $50 billion.
The gap between 16 and 15 has a name: Kenvue (KVUE). Its debut history could not be reconstructed from the Yahoo daily prices retrieved through yfinance, although its offering is documented. We keep that gap visible. Anthropic is also outside the historical cohort: its case is prospective.
These two lists let us ask a clear question, but they are not a representative census of every large IPO. The medians below describe these cases. They provide context from large offerings for the question about ANT; we do not claim their businesses, valuations or paths will resemble Anthropic's.
After the first close
3If you buy at the first close, what happened in other debuts?
To keep the cast of companies from changing at every point, the main chart follows the same 14 cases from session +1 through +126. Space Exploration Technologies (SPCX) had not yet reached +126 and is excluded from this fixed series. Each mark is the median return measured from D0, not the path of any one stock.
Swipe to see the full chart →
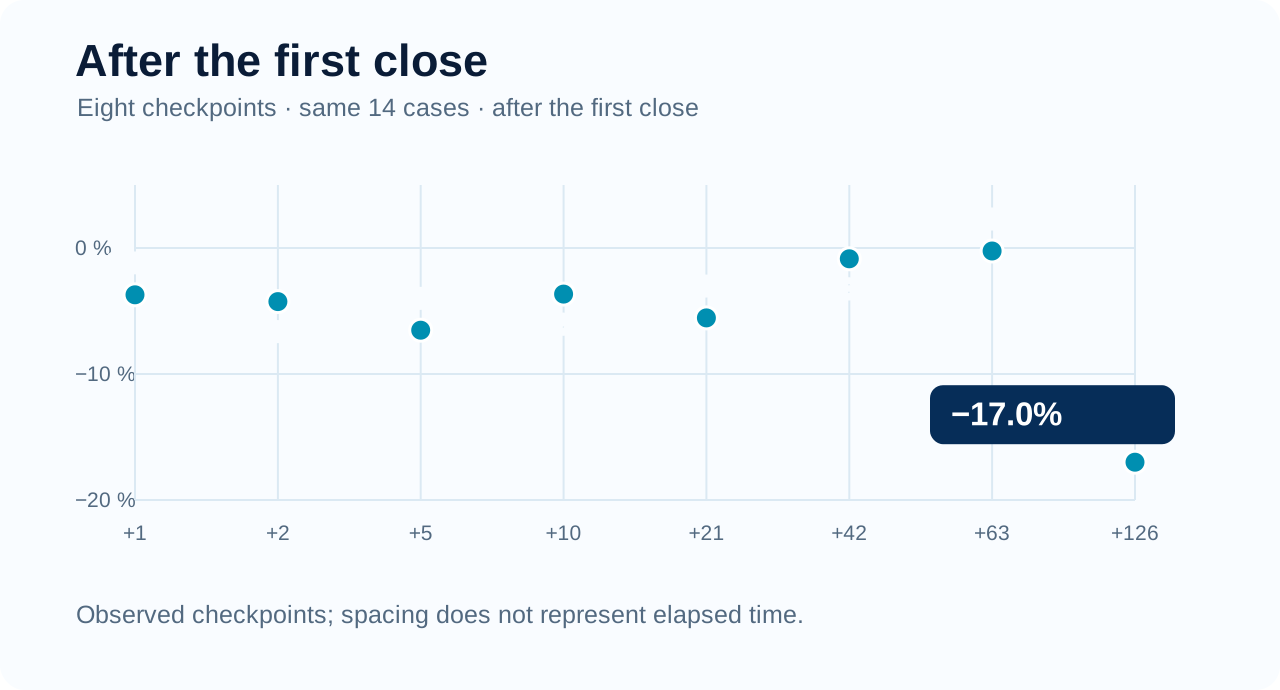
By session +126, the median stood at −17.0% from D0, and 11 of the 14 cases were below their first close. A market comparison is available for 13: the Kenneth French daily series (Mkt-RF + RF) ends before Cerebras Systems (CBRS) reaches its +126 date. Among those 13 cases with matched dates, only two stocks beat the market.
The calendar matters too
4Nine horizons, with the denominator in plain sight.
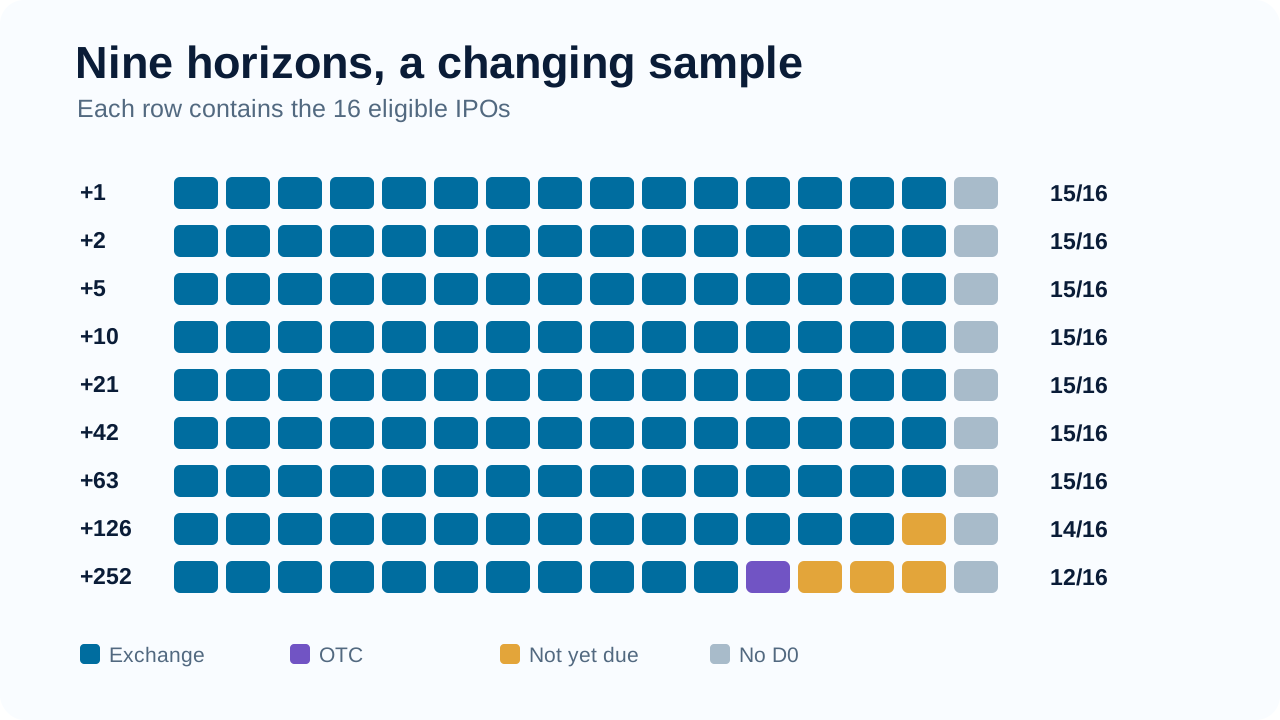
“A month later” sounds simple until each company has a different debut date and some have not been public for a full trading year. The study uses scheduled NYSE or Nasdaq sessions: +1, +2, +5, +10, +21, +42, +63, +126 and +252. A missing session is neither replaced by the next one nor treated as a 0% return.
Swipe to see the full chart →
Swipe the table to see what is missing →
| Sessions from D0 | With a price | Missing |
|---|---|---|
| +1 | 15 of 16 | KVUE, no D0 |
| +2 | 15 of 16 | KVUE, no D0 |
| +5 | 15 of 16 | KVUE, no D0 |
| +10 | 15 of 16 | KVUE, no D0 |
| +21 | 15 of 16 | KVUE, no D0 |
| +42 | 15 of 16 | KVUE, no D0 |
| +63 | 15 of 16 | KVUE, no D0 |
| +126 | 14 of 16 | SPCX not yet mature; KVUE no D0 |
| +252 | 12 of 16: 11 exchange, 1 OTC | CBRS, MDLN and SPCX not yet mature; KVUE no D0 |
The previous chart uses 14 cases at every point, even though 15 prices are available through +63. Holding that cast fixed lets us read a sequence of medians with the same composition. The final horizon gets its own 12-case snapshot.
The price moves before the opening bell
5The preliminary range is not the offer price either.
A third number often makes headlines before an IPO: the indicative range in its prospectus. It is not an executed purchase. We found an initial numeric range and final price for 15 of the 16 eligible IPOs; Space Exploration Technologies (SPCX) had one expected price, not a range. Fourteen of the 15 cases with a range also had a first close to compare: Kenvue was missing. In 13 of those 14, both the revision from the initial midpoint to the final price and the day-one jump were positive. Uber had both moves below zero. That coincidence describes this selection; a preliminary range is not a forecast.
This matters especially for Anthropic. Its $70–78 range is still a proposal: the final price and first close are unknown. A range alone cannot give us either the day-one jump or what comes next.
The story before the bell
6Curiosity surges. The stock gets no map.
An IPO does not spring into existence when the bell rings. In the preceding weeks, people search for the company and visit its page. We measured that attention for the same 16 IPOs using two different thermometers: Wikipedia pageviews and Google Trends searches. Neither measures share purchases.
For each company, we compared mean daily attention over the 28, 14 and 7 calendar days before its debut with one fixed 84-day baseline preceding the 28-day window. The reference stays put as the window narrows. Debut day itself is excluded.
Wikipediapageviews · 11 of 16 IPOs with a ratio
In 11 of 11 cases, the final week's daily mean exceeds the 28-day mean.
Google Trendssearch index · 13 of 16 with a usable signal
The same pattern appears in 13 of 13 cases with enough signal.
The attention pattern is striking, but coverage has limits. Wikipedia yields a ratio for 11 of 16 IPOs: Alibaba, General Motors, Meta and Visa debuted before article-level pageview data began; Kenvue lacked an accredited page title at the baseline's start. Trends yields 13 of 16; ARM, Snowflake and Visa fell below its minimum signal threshold. Missing is not zero, and Trends indices are comparable only within each query.
And Anthropic? In a rolling snapshot ending 14 November 2026, its last week saw 27.3% more Wikipedia pageviews and an 89.7% higher Trends index than their respective baselines from 26 July through 17 October. Those percentage changes correspond to ratios of 1.27× and 1.90×; the two sources' levels are not compared. This is current attention, with no debut date yet to align those windows to the historical IPOs. It is not an ANT return.
The next question
7What do we know about ANT before making any decision?
It is tempting to put ANT at the end of the curve and ask which earlier blockbuster IPO it might resemble. There is no observed point to plot. Its preliminary SEC prospectus proposes 825 million Class A shares, an indicative range of $70–78, and an application for the ANT symbol on Nasdaq. Anthropic announced its roadshow on 10 November 2026. That describes a proposed offering, not an observed debut.
ANT · Prospective case
The box we have to leave empty
Measuring the pop will require a final offer price and a confirmed first close. Measuring what happens next will require subsequent trading sessions. None of those returns has been observed yet.
Once there is a verifiable debut, the two questions are ready: how far was the first close from the offer, and what happened after that close? The history of 16 IPOs cannot answer either question for ANT in advance.
What stays with us
8History can sharpen the question. ANT will have its own path.
The first-day jump can be enormous and the later move modest, as with Airbnb. It can precede another strong rise, as with ARM, or a further fall, as with UBER. This study turns none of those stories into a rule. It does require us to state the whole measurement: from the offer or from the first close, at which horizon, and across how many cases.
The offer price was not open to everyone; the D0 close does not guarantee an exact purchase either. Yahoo Finance adjusted prices follow their own conventions. KVUE is missing, DIDIY moves to OTC at +252, and recent offerings have not yet accumulated a full trading year. The first day deserves a headline. To understand what came next, start at the first close.
Under the hood
9How we measure journeys and attention without conflating them.
Offer prices and offering sizes come from prospectuses filed with the SEC. Daily closes come from Yahoo Finance through yfinance; calendars follow scheduled NYSE or Nasdaq sessions. The market reference compounds Kenneth French daily factors on matching dates where available. Adjusted prices reflect splits and dividends under Yahoo's policy.
The two formulas and their limits
Debut jump: nominal D0 close / final offer price − 1. Subsequent return: adjusted D+h close / adjusted D0 close − 1. The offer-to-D+h result compounds both legs: (1 + jump) × (1 + subsequent return) − 1. Visa's historical close required reconstruction to the unit before its 4:1 split; Kenvue lacks a recovered D0 history; DiDi trades OTC as DIDIY at +252. The 21-candidate selection was fixed before returns were examined and is not a census of all mega IPOs.
Attention uses Wikimedia daily pageviews and the Google Trends index. Each ratio divides a recent window's daily mean by the earlier shared baseline mean. The windows are nested; Trends normalizes each query to its own scale, and zeros may reflect censored signal. Neither source measures orders, allocations or investor demand.