
Qinvia Research · Market structure and behaviour
Every crypto cycle needs someone who missed the last one
The old buyers got burned. The new ones found AI.
Bitcoin can become a better asset while crypto becomes a weaker speculative machine. The distinction matters: a strong headline price does not guarantee a broad party, and a broad party was what supplied much of the opportunity that once looked natural in this market.
“A price chart can recover faster than a person’s willingness to be the last buyer again.”
1Every cycle needs fresh memory
There is a scene that repeats in markets. Someone arrives late to a party, hears that everybody made money, and decides the secret must have been arriving earlier. Next time, they will arrive earlier. Next time, they discover that “earlier” was three months ago, two memes ago, and before a family dinner where everyone had a view.
Crypto turned that scene into a genre. It had rocket ships on charts, screenshots with too many zeros, friends discussing a coin as though they had found a geographic shortcut, and an industrial quantity of certainty. It also had losses. And losses, unlike memes, tend to remember the date.
Someone who bought when the conversation was unavoidable and sold when it became awkward now meets fresh Bitcoin headlines with a caution no candlestick chart can display. They can still believe technology matters while no longer believing every rise demands an action. A curve records prices; it does not record the moment someone closes the app and decides to think twice.
This article is not about whether Bitcoin can rise. It can, it has, and it now has entry routes that look more like familiar investing than learning the customs of a subculture. The more uncomfortable, and more Qinvia, question is this: can Bitcoin improve as an asset while the rest of crypto loses some of the breadth, reflexivity, and exploitable disorder that defined earlier cycles?
The available evidence gives us a reason to begin with memory. The Urban Institute national survey, conducted in January 2026, found that 9% of US adults were current crypto owners and 8% were former owners. Among former owners, 32% cited losing money; volatility and security each appeared in 28% of answers about why they stopped investing. Among people who had treated crypto as a long-term investment, former owners more often reported an outcome worse than expected and a negative financial impact than current owners did.
That does not turn every former owner into walking scar tissue. It does leave a trace. A person who lost money can return; a person who did not can leave; a market can recover in price without recovering the same willingness to participate. Price and trust run on different clocks.
The Philadelphia Fed gives those clocks a particularly revealing outline. Across its observed waves, measured ownership fell from 17.1% in October 2023 to 14.7% in July 2024 while Bitcoin was recovering highs. Stated purchase intent had revived first: in April 2024, 13.4% of non-owners said they were likely to buy, up from 4.0% in October 2022. Curiosity opened the door before ownership walked through it.
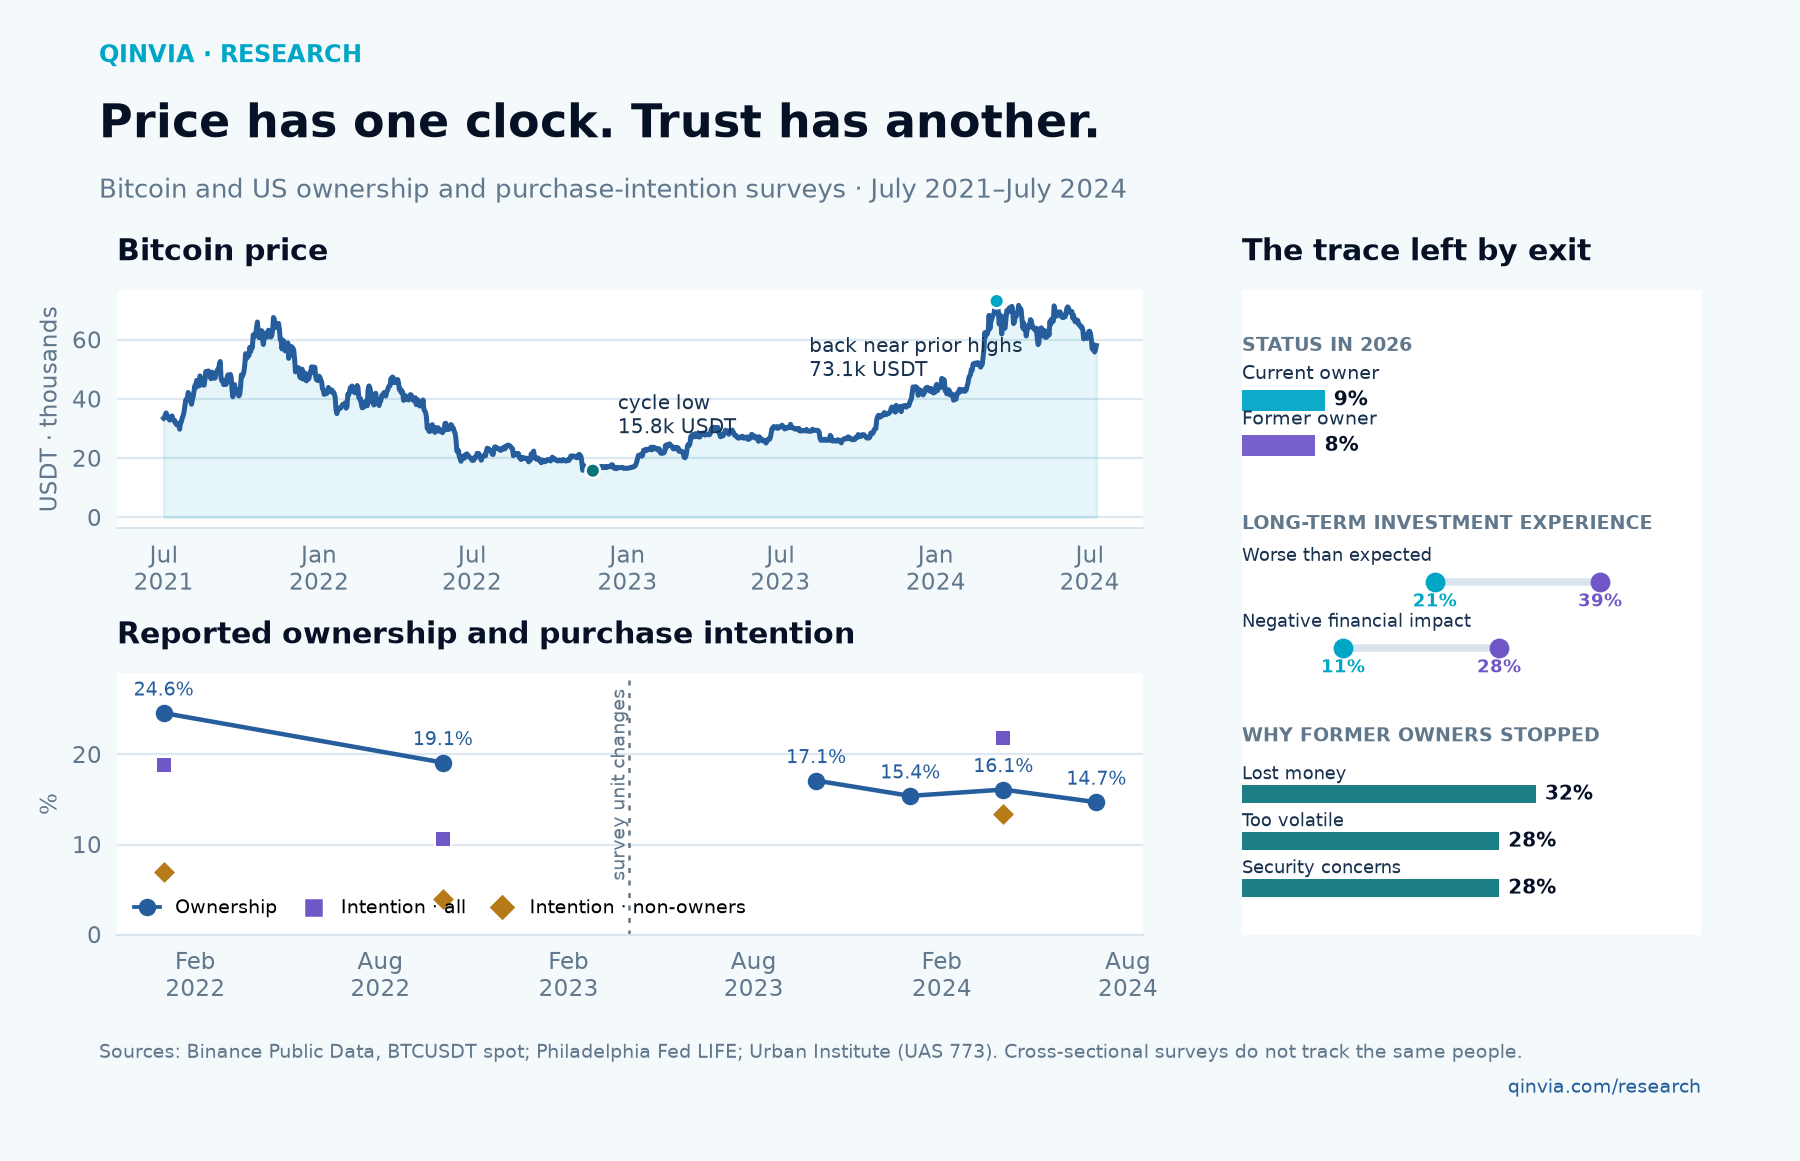
Figure 1. Price has one clock. Trust has another. Bitcoin beside current ownership, former ownership, and purchase intent; a small Urban panel shows why former owners stopped investing.
Reading: price recovery and participation recovery are different objects.
Source: Philadelphia Fed LIFE; Urban Institute, 2026.
Limit: the surveys show population snapshots, not the same person followed over time.
The BIS adds a pattern familiar to anyone who has watched a bubble from inside: exchange-app adoption followed Bitcoin price rises, and its simulation estimates that 73% to 81% of those entrants probably lost on their initial investment. It is a picture of entry and likely outcome, not every account’s bank statement. Still, it helps explain why the memory of a fall can become a market ingredient, rather than simply a dinner-party story.
Crypto did not just lose money. It used up investors.
That distinction matters for the next buyer. A chart offers everyone the same past in one clean line. A participant carries a past made of the entry price, the size of the position, the timing of a bill, an exchange outage, and the small humiliation of explaining a drawdown to someone who already thought the whole idea was odd. Markets aggregate those private calendars imperfectly, but they do aggregate them.
Memory does not kill cycles. It makes them more expensive to repeat. For a party to regain the same volume, it needs people who do not remember where the emergency exit was—or who believe this time the building is different.
2Bitcoin succeeded; the cycle narrowed
There is a comfortable way to talk about crypto: look at Bitcoin, see a rise, and declare that the cycle is back. It is analysis a little like hearing the lead singer in tune and concluding that the whole band is playing well.
Bitcoin can fill the stadium. The question is what happens backstage.
In the familiar cycle, the story spread outward. Bitcoin drew attention. Ether answered. Then came smaller assets, platforms, protocols, and promises with names that sounded as though they had been selected in a brainstorm held at three in the morning. The expansion was not necessarily healthy. But it was broad: return differences widened, winners and losers moved less in lockstep, and variety created terrain for systematic strategies.
A narrow cycle has another choreography. Bitcoin can be strong while the relay arrives with less energy. Fewer assets may beat Bitcoin. Prices may move together. Attention may concentrate. “Everything goes up” becomes “something is going up very well.”
This time the comparison need not remain an impression. Qinvia rebuilt two matched clocks: 540 days after the 2020 and 2024 halvings, with assets selected only from information available at the start of each race. Choosing today’s winners for yesterday’s universe would be like handing out bib numbers after watching the finish.
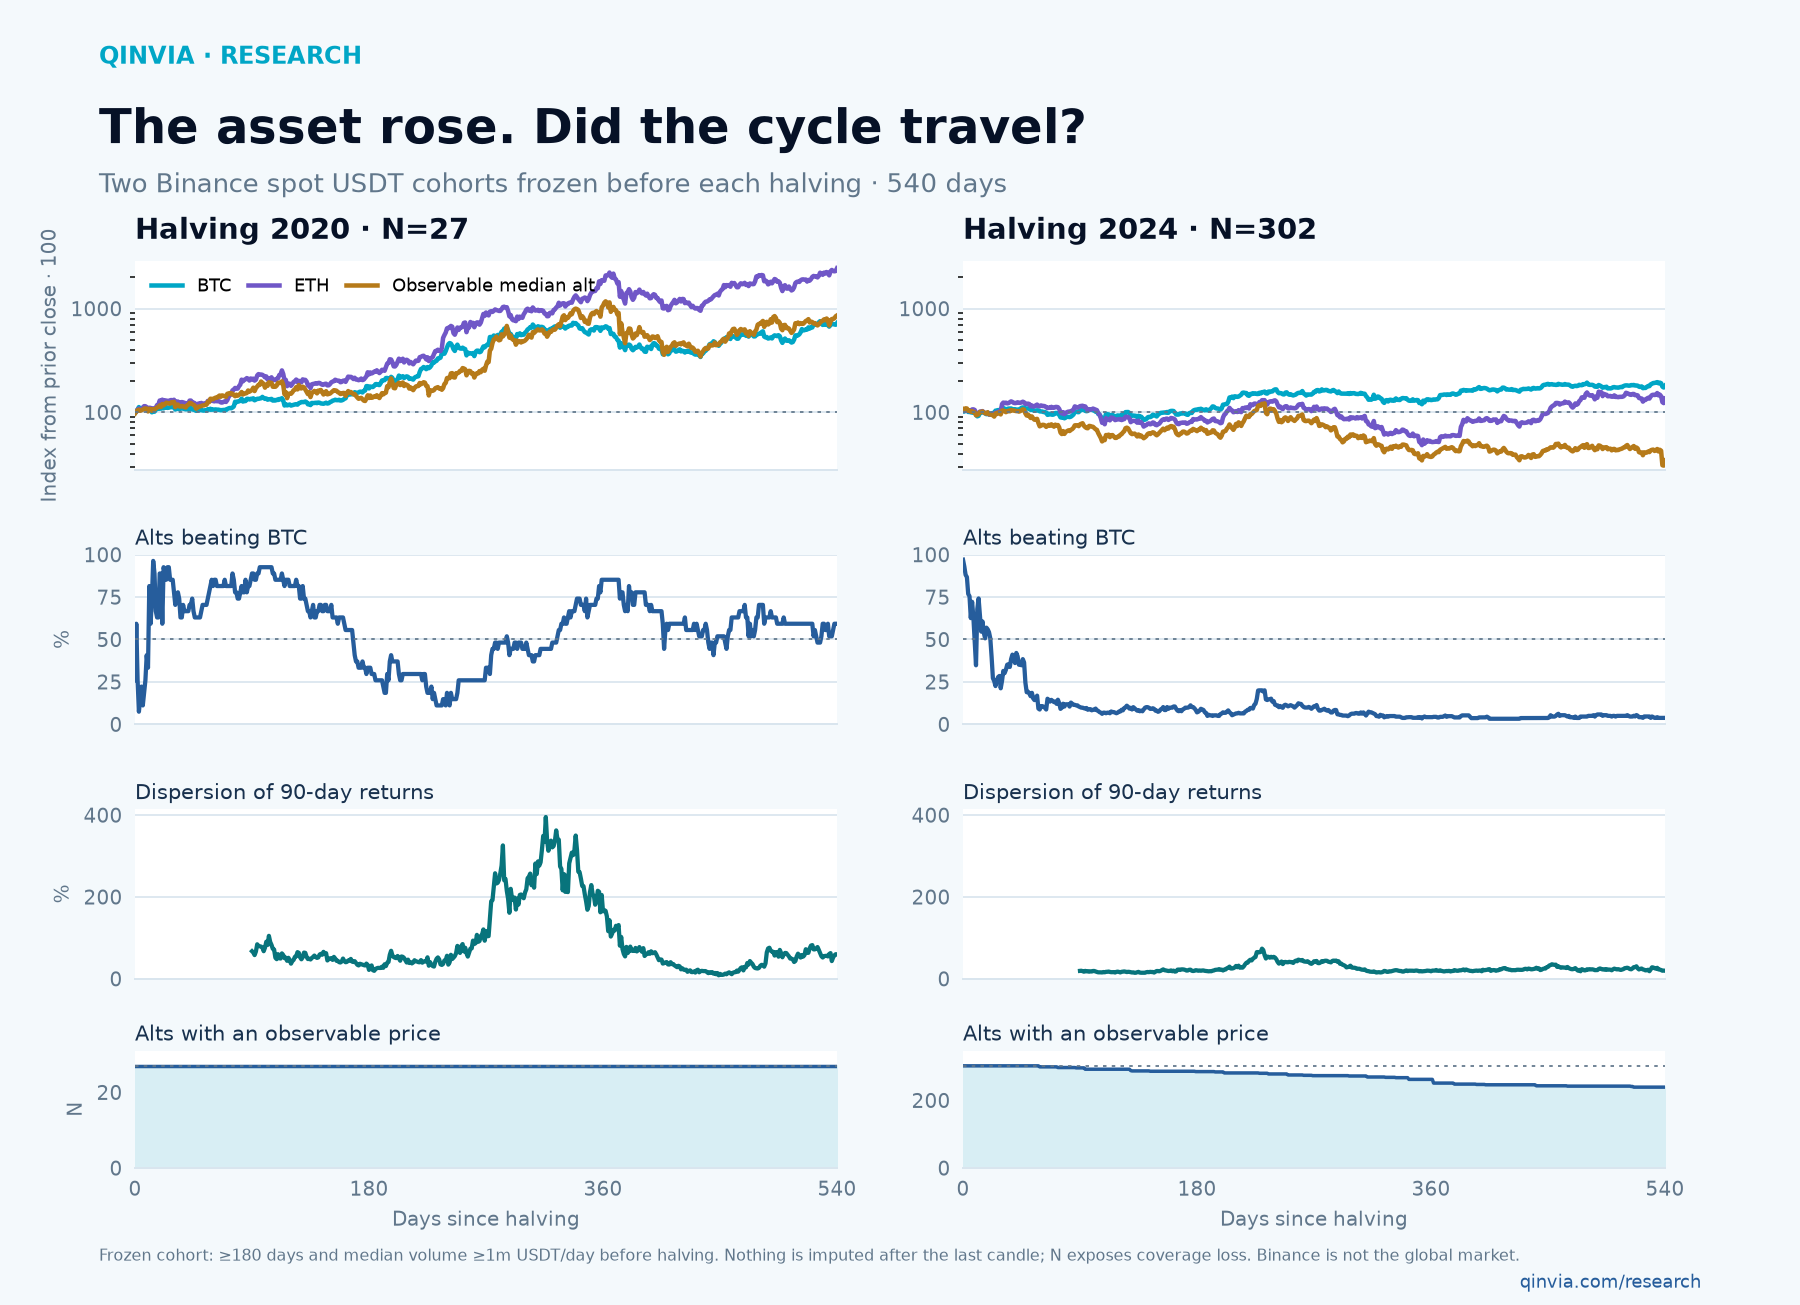
Figure 2. The asset rose. Did the cycle travel? Matched cycle clock: BTC return, median alt return, breadth beating BTC, dispersion, and eligible-asset count.
Reading: a large Bitcoin return and a broad cycle are different objects.
Source: Binance Public Data; spot-USDT cohorts frozen before each halving, 540 days.
Limit: this is Binance spot, not the global market. The absolute cohort and rank-matched comparison are frozen before each halving; assets without a final candle remain visible as lost coverage and receive no invented return.
Bitcoin succeeded. The cycle failed.
The distinction is more useful than a semantic debate. Breadth asks how many assets join a move. Dispersion asks how different their returns are. Concentration asks how much weight rests on a small number of names. Each answers a different question. Folding them into one word—“altseason”—is entertaining, but leaves the reader without a way to see what has changed when the show changes.
The measurement itself requires a look under the bonnet. A crypto universe moves: assets appear, vanish, delist, lose liquidity, and sometimes return with a new logo and an old explanation. Each cohort was frozen before its halving using at least 180 days of history and USD 1 million in median daily USDT volume; stablecoins and leveraged products were excluded. Twenty-seven alts qualified in 2020 and 302 in 2024. By day 540, 59.3% of the 2020 alts were beating Bitcoin, against 3.8% of the 239 still observable in 2024. Figure 2 shows the whole path: the result does not depend on choosing one flattering endpoint.
There was, however, a fairer comparison to make. Qinvia repeated the test with the 27 most liquid alts in each cycle, ranked solely by median volume during the 180 days before each halving. The gap remained: 85.2% versus 12.5% at day 365; 51.9% versus 12.5% at day 450; 59.3% versus 16.7% at day 540; and 42.3% versus 12.5% at day 630. If every missing asset is conservatively counted as a non-winner, the 2024 figure at day 540 falls from 16.7% to 14.8%. That is a prudent bound, not an observed loss. The wider universe exaggerated the contrast; it did not create it.
3The speculative instinct found more than one screen
If the previous generation of financially curious people learned three letters—BTC, ETH, and perhaps a fourth they would rather forget—the next one found a bright screen called AI. The difference is not that artificial intelligence has an exponential-growth story. Crypto had one too. The difference is that many people can touch AI during the workday before deciding whether to invest in it.
A model drafts a note, summarises a meeting, writes a line of code, or answers an awkward question before someone has finished explaining what a blockchain is. That gives the AI story a daily anchor. It does not show that AI is cheap, better, or that it stole buyers from crypto. It does create a contest between narratives: two future-facing promises seeking the same spare attention, the same technological curiosity, and sometimes the same risk budget.
The article does not need to pretend that it can read that budget’s mind. It can observe attention. Google Trends can compare, in one joint query with the same parameters, Bitcoin, ChatGPT, and artificial intelligence. Wikimedia supplies an independent check through monthly pageviews for those English Wikipedia articles. A search and a pageview are not a buy order. At their best, they are traces of interest.
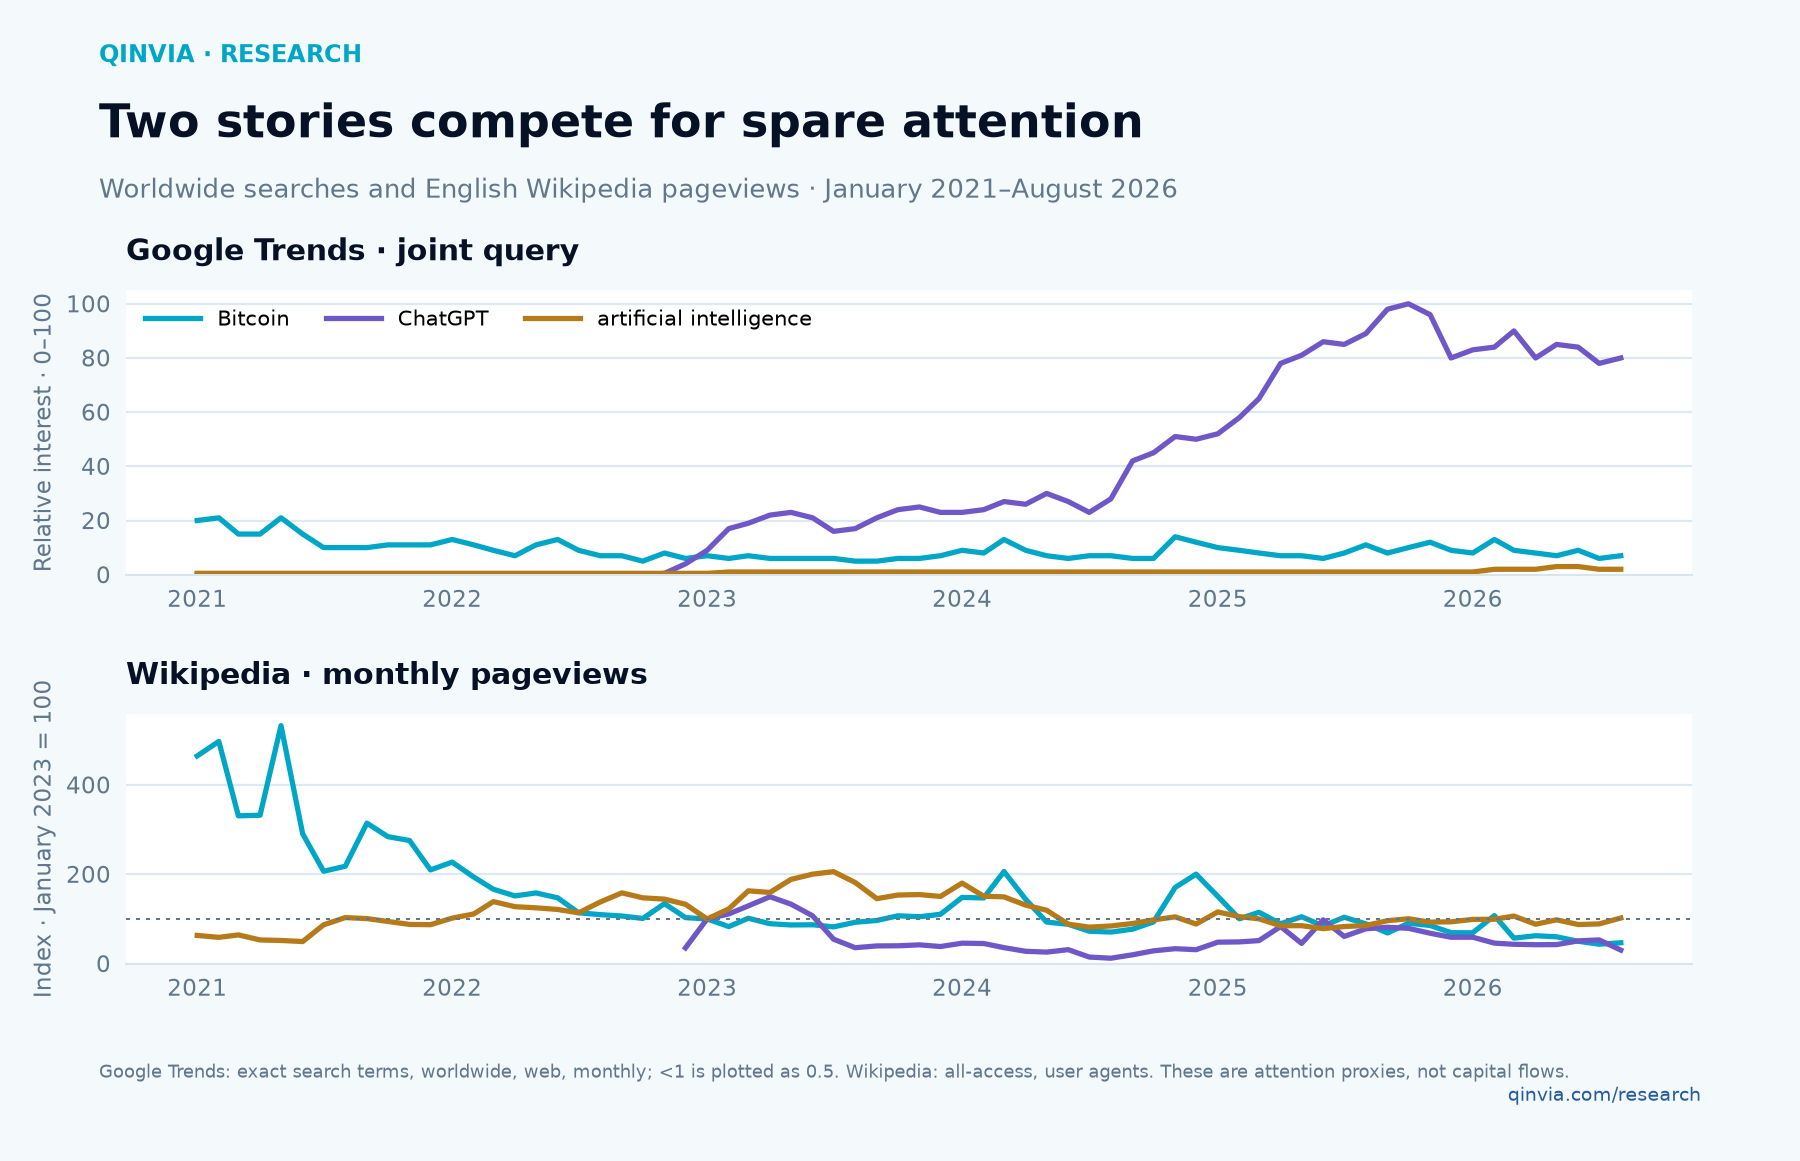
Figure 3. Two stories competing for the same spare attention. Google Trends and Wikipedia-pageview small multiples for Bitcoin, ChatGPT, and artificial intelligence.
Reading: attention measures can diverge without showing that the same money moved.
Source: Google Trends; Wikimedia Pageviews API.
Limit: this is an attention map, not a tracker of people or capital.
The visible difference is concrete. In the joint Google Trends query, ChatGPT scored 80 in August 2026 and Bitcoin scored 7. In the same month, English Wikipedia recorded 1.62 million pageviews for ChatGPT, 355,079 for artificial intelligence, and 81,965 for Bitcoin. These are not investment flows and they do not identify the same people. They do show that the technological story capable of absorbing curiosity no longer lives on one screen.
The speculative instinct did not disappear. It changed address.
There is a related temptation to compare private AI investment and crypto venture capital as though they were two bars on one receipt. Stanford HAI reports USD 285.9 billion of US private AI investment in 2025; Galaxy Research reported more than USD 20 billion for crypto/blockchain that year. They are large and interesting figures built on different coverage, geography, and taxonomy. They belong in context, not under a hastily invented division sign.
The relevant idea is not that AI replaced crypto. It is that the market for technological stories has more than one entrance, and each entrance can draw a different kind of participant. That makes it more important to measure crypto’s own structure, rather than explain it with a sentence too good to be testable.
4The new door into Bitcoin
For years, buying Bitcoin required a modest initiation ceremony: choosing an exchange, understanding custody, learning vocabulary, finding a password that sounded like an incantation, and explaining to a relative why “it is not at the bank” did not necessarily mean “it does not exist.”
The approval of spot Bitcoin ETPs in the United States opened another door. An ETF share fits in a brokerage account beside funds, shares, and the promise that one will read the prospectus later. The vehicle does not turn Bitcoin into an equity. It changes the path through which some demand can reach it.
That matters because entry channels can change market tempo. iShares publishes IBIT holdings and shares outstanding; the CFTC classifies CME futures positioning by functions such as Asset Manager/Institutional, Leveraged Funds, and Other Reportables; Coinbase reported USD 215 billion of institutional spot volume and USD 56 billion of consumer spot volume for its own platform in Q4 2025. These are windows into particular vehicles and venues. Together, they describe infrastructure rather than a new species called “the institutional investor.”
TWO DOORS, ONE ASSET
The door changed.
Then
Now
Figure 4. The door changed. An access diagram from exchange-led routes to ETF, futures, and brokerage routes, anchored by spot-ETP approval, trust holdings, and CFTC positioning facts.
Reading: the wrapper changes access; it does not reveal every owner’s identity or patience.
Source: SEC; iShares/IBIT; CFTC Traders in Financial Futures.
Limit: an ETF share can ultimately belong to a retail investor, an adviser, or an institution.
The new door can lower frictions. It can let some buyers enter with different portfolio rules. It can make Bitcoin look like an allocatable exposure rather than a ticket into a community. The wrapper does not tell us who owns the asset, but it changes the kind of portfolio Bitcoin can enter. It can also coexist neatly with the older exchange market, leverage, liquidations, and every form of enthusiasm that has never asked permission from a regulator.
That is why “institutionalisation” needs commas. It means observable infrastructure, regulated wrappers, and functional participants in specified markets. It does not mean that every owner is patient, that the market has stopped carrying risk, or that ETFs alone explain a possible shortfall in altcoin breadth. The interesting story is not that Wall Street entered crypto. It is that the building has more doors, and every door can alter who enters, how they enter, and what they can see from inside.
At this point, a buyer no longer needs to memorise a seed phrase or check a withdrawal address three times to gain exposure. Bitcoin can appear on the same screen as an index fund. That convenience changes the access experience. It still leaves the decisive questions open: what money does after it enters, how long it stays, and whether it wakes the rest of the market.
5When the relay baton stops travelling
Earlier crypto cycles often looked like a relay race. Bitcoin set off. Ether took the baton. The move then spread through a crowd of assets competing to become the next topic of conversation, the next narrative, and occasionally the next customer-support problem.
The relay image is useful because it suggests a visible test. If a move spreads, it should leave fingerprints: more assets participating, larger differences among their returns, rotations between large and small names, changes in funding and basis, and perhaps activity distributed across chains. When the baton stops travelling, the cycle may concentrate around the lead runner.
The previous clock lets us watch the relay without hiding behind an attractive arrow. In 2020, Bitcoin reached day 540 at 7.25 times its starting price and Ether at 24.47 times; the observable median alt had reached 8.58 times. The baton travelled. In 2024, Bitcoin reached 1.80 times its start, Ether 1.36, and the observable median alt 0.35. More runners stood in the opening photograph, but almost none followed the leader to the line.
THE RELAY
The relay lost its runners.
The handoff exists only if breadth and dispersion confirm it; the arrow does not decide the result.
Figure 5. The relay lost its runners. A conceptual map of the BTC → ETH → wider-market journey; the quantitative 2020-versus-2024 comparison is in Figure 2.
Reading: the 2020 cycle carried the rise through its cohort; the 2024 cycle reached day 540 far more concentrated in Bitcoin.
Source: Binance Public Data; the same frozen cohort and clock used in Figure 2.
Limit: this describes two Binance spot-USDT cohorts; it neither represents the whole crypto market nor proves what caused the difference.
“Earlier cycles looked like a relay. A narrow cycle can be one runner taking victory laps.”
The question matters because the relay was part of speculation’s economics. It turned a Bitcoin rise into a chain of fresh bets. It created breadth, liquidity, and a generous quantity of disagreement. It also created bad decisions, of course. A market does not become admirable because it offers more ways to be wrong. But for a quantitative practice, that disorder can create signals, premia, execution inefficiencies, and price differences worth studying.
A shorter relay does not mean a dead market. It may be a selective market, a phase, or a pause before a different story. The research task is not to put a headstone on altseason. It is to test whether the relay’s fingerprints are now weaker, more concentrated, or simply different.
6Where the edge disappears first
Crypto made one confusion unusually popular: price, opportunity, and a repeatable edge are not the same thing.
Price asks whether Bitcoin rose. Opportunity asks whether assets differed in ways that could be used, whether there was enough movement, a premium worth the risk, and enough liquidity to turn an idea into a trade. An edge asks the less romantic question: after costs, mistakes, liquidations, and bad weeks, did a fixed rule earn anything beyond simply owning Bitcoin?
A market can fill headlines and leave little for a system. It can also calm down and retain opportunities: following a trend, collecting a premium, or trading more efficiently. Volatility alone is noise. Dispersion only says that prices differ, not that those differences can be traded. And an attractive premium can vanish once spreads, collateral, slippage, and platform risk arrive. Markets, regrettably, can do arithmetic.
Earlier research gives us reason to ask. Liu, Tsyvinski, and Wu found common patterns and momentum in earlier samples; Makarov and Schoar observed price gaps across markets widening as Bitcoin rose. Those are precedents, not a promise for 2026.
Here is the question most characteristic of Qinvia. The previous figure confirms that breadth and dispersion compressed in this comparison. It does not prove that a particular strategy stopped working or that every premium vanished. Answering that requires passing through three doors: direction, differentiation, and capture. The last door always presents the bill.
The real question is not whether Bitcoin can go higher. It is whether crypto still produces the same amount of exploitable disorder.
THE TEST
The opportunity set is not the price chart.
There is an edge only if rules fixed in advance survive costs and new data.
Figure 6. The opportunity set is not the price chart. Three filters separate a visible rise from an edge that can actually be traded.
Reading: breadth and dispersion narrowed in the sample; turning that into a strategy conclusion requires frozen rules, costs, and new data.
Source: Qinvia research framework; descriptive evidence from Figures 2 and 5.
Limit: this article assigns no net return to momentum, carry, or arbitrage strategies.
An edge can disappear when the story has fewer protagonists, but the link is not automatic. If many assets do the same thing, if familiar premia narrow, and if trading costs rise faster than the signal, a market can remain emotionally busy and economically thin. That is what Qinvia wants to examine: not whether “everything matured,” but whether anything remains after paying the bill and checking it against new data.
7The test Qinvia would actually run
A good story earns the right to become a test. It does not get to skip the test.
The design avoids a few seductive tricks. It does not pick a cycle low after seeing the chart. It does not rebuild 2017 from coins that survived to today. It does not call shorting an unborrowable token a strategy. And it does not mistake a gross funding premium for money lying on the floor.
The public test uses one UTC clock. The figure aligns the first 540 days after the 2020 and 2024 halvings, while the robustness check extends the reading to day 630. A halving is a calendar date, not a magical button. To enter, an asset needs 180 days of history and at least USD 1 million in prior median daily USDT volume. Stablecoins, wrappers, and leveraged tokens are excluded. Assets that disappear remain in the film through their final observation. A study about market memory would look odd if it edited out everyone who did not make it to the credits.
Then the rules are set: follow trends over fixed periods, compare relative strength across assets, collect the premium between spot and perpetual contracts, and arbitrage spot against dated futures. Each rule pays its bills: fees, spreads, slippage, borrowing, funding, contract rolls, transfers, collateral, and a buffer against liquidation. If a strategy looks good only before paying those bills, it may not have been a strategy. It may have been a model home.
The important part comes last. Using only information available at the time, the research describes the market: breadth, dispersion, correlation, volatility, premia, and cost. It then asks whether that picture anticipates net gains in the next period beyond Bitcoin exposure, and compares it with much simpler rules. If it only anticipates more risk, it has described risk. If it survives costs and data not used to design it, it has begun to describe opportunity.
“A good story earns the right to become a test. It does not get to skip the test.”
8What would prove us wrong?
The healthiest way to love a thesis is to prepare its emergency exit.
The story of a narrower crypto market and a Bitcoin with new access routes would change shape if a new broad retail cohort appeared; if most of the universe regained breadth and beat Bitcoin; if dispersion, funding, leverage, and basis returned to levels comparable with earlier cycles; or if ETF demand behaved visibly and reflexively alongside the exchange market. It would also change if a frozen strategy battery showed no deterioration in net edge—or found a new one in another corner of the market.
Scar tissue can heal. Generations arrive. Markets are exceptionally good at finding people who have not seen the film and offering them a remaster with a better interface.
Some former buyers will return and others will not. Some will find Bitcoin in an ordinary investment account and leave untouched the curiosity that once took them into altcoins. Others will wait for a different technological story. We do not need to invent their decisions. We only need to remember that a market is made of many such choices, taken with different memories and under access rules that keep changing.
That possibility does not weaken the article. It makes it useful. The thesis is not that Bitcoin stopped being interesting or that crypto stopped producing opportunities. It is that a maturing asset and a repeating speculative machine are different things. Sometimes they travel together. Sometimes one learns to wear a suit while the other loses part of its old choreography.
Markets do not need to die to stop paying. Sometimes they simply grow up. When they do, the question stops being how far the lead coin rose. It becomes where the next repeatable error lives, who still makes it, and what it costs to arrive before everyone else.
Method note
This article separates facts, approximations, and hypotheses. F1 captures aggregate traces, not personal biographies; F3 measures attention, not money or identity; and F4 shows access routes, not the final owner of every asset. F2 and F5 rebuild frozen historical Binance spot-USDT cohorts rather than the whole market. The main comparison uses an absolute liquidity threshold; the like-for-like check selects the 27 alts with the highest median volume during the 180 days before each halving and repeats the reading at days 365, 450, 540, and 630. The conservative bound treats every absence as a non-winner without pretending to know its return. F6 separates descriptive evidence from a future strategy test with costs and new data.
Bibliography and sources
- Urban Institute, Crypto Assets and Financial Well-Being (2026)
- Federal Reserve Bank of Philadelphia, Do Price Changes Affect Crypto Ownership?
- BIS Working Paper 1049 and BIS Bulletin 69
- Binance Public Data
- Google Trends documentation; Wikimedia Pageviews API
- Stanford HAI, AI Index 2026: Economy; Galaxy Research, Crypto and Blockchain Venture Capital — Q4 2025
- SEC statement on spot Bitcoin ETP approval; iShares Bitcoin Trust; CFTC Traders in Financial Futures
- Coinbase Q4 2025 shareholder letter filed with the SEC
- Liu, Tsyvinski, and Wu, Common Risk Factors in Cryptocurrency; Makarov and Schoar, Trading and Arbitrage in Cryptocurrency Markets
The open question
How much exploitable disorder remains?
Bitcoin's price cannot answer on its own. Sources, universe rules and each figure's limits are linked in the article so the hypothesis can be challenged, extended or rejected.
Back to Research